
05.05.2020
How can scientists collaborate to end the social distancing measures?
by Koen Decancq
In this brief note, I sketch a framework that may help us to think about finding an exit-strategy from the Covid-19 social distancing measures. The central idea of the framework is that these measures have an impact on the reproduction number as well as on social welfare. While the reproduction number is clearly defined, the notion of social welfare is a bit more elusive. I argue that social welfare should be conceived in a multidimensional way, giving extra weight to the fate of the worst-off. Optimally, we should end those social distancing measures that reduce social welfare a lot, but have a small effect on the reproduction number. To identify these measures, I propose that scientists from different disciplines join forces and construct together a ‘policy leaderboard’. With this leaderboard we will be able to identify the policies that combine a large impact on social welfare with a low contribution to the reproduction number. Virologists and epidemiologist can measure the effects on the reproduction number and social scientists and economists can study the impact on social welfare.
An important parameter to describe the evolution of an epidemic as Covid-19 is the reproduction number R. It is the expected number of new cases directly generated by one case. The higher R, the faster the epidemic spreads and the more people will be infected in the end. Without intervention, an epidemic grows exponentially until a proportion 1-1/R of the population is infected (and immunized). An epidemic with R<1 dies out eventually. Estimates of the initial R for Covid-19 are around 3 (Liu et al., 2020). That means that in a scenario without policy intervention, about two thirds of the population will get Covid-19. Not everybody who is infected dies from the virus. Fatality rates are estimated between 1% and 4%, depending on the state of the health care system and the age composition of the society. Hence, a simple back-of-the envelope estimate is that about 0,66% and 2,64% of all people will. Researchers from the Imperial College London have made more precise estimates in same order of magnitude.
To avoid such a catastrophic loss, governments have intervened. In his insightful discussion, Thomas Pueyo distinguishes two phases in the policy response to an epidemic as Covid-19. In Phase 1 (which he calls the ‘hammer’), the aim is to reduce the reproduction number as quickly as possible. The aim is to avoid a collapse of the health care system that would increase the fatality rate. To achieve a reproduction number substantially below 1, many countries have now gone into a state of ‘hibernation’ by imposing stringent social distancing measures. After the peak of the epidemic has passed, the next phase starts (the so-called ‘dance’). This phase will last until the virus has died out or a vaccine is found. The chance that virus will die out without vaccine seems rather slim. Yet, finding and producing a vaccine may take 18 months or more. Does this mean that we should all remain in ‘hibernation’ for a year and a half?
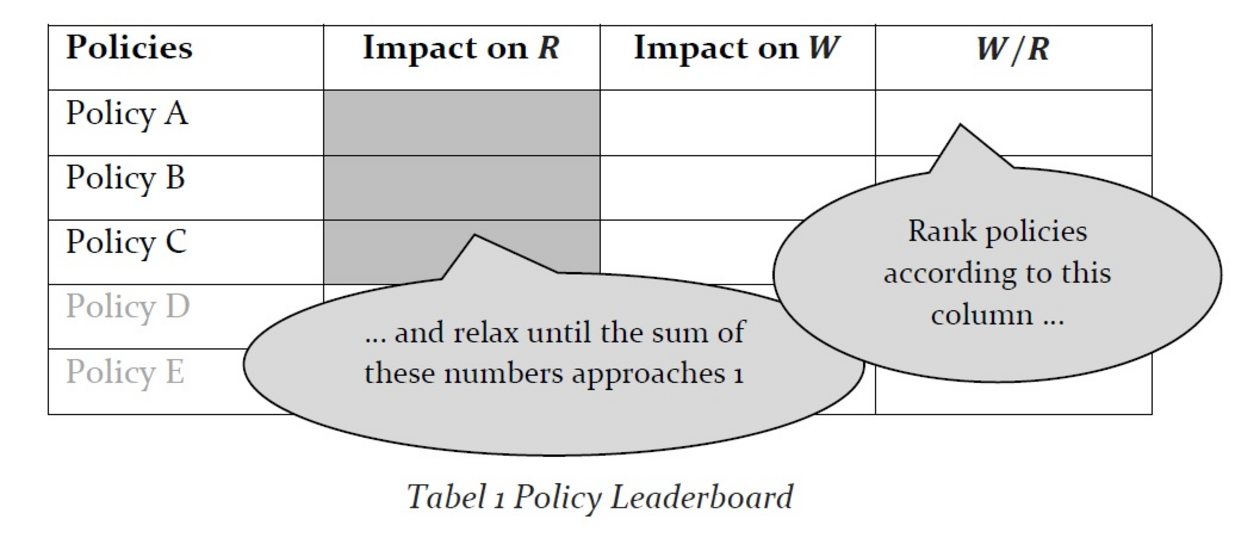
Luckily, the answer is no. In the second phase, when R has fallen substantially below 1, there is room to relax some policy measures that have been imposed in the first phase, as long as R remains sufficiently low (and below 1). The challenge is to do this in a clever way, so that we can reach the highest social welfare during the (potentially long) second phase. Let’s assume for a moment that this social welfare can be quantified by a number W. The policies to be relaxed first are the ones that have a large impact on social welfare W while having a low contribution to the reproduction number R. We can find these policies by ranking all possible policies by the ratio W / R in a leaderboard (pretty much as candidates are ranked in cooking competitions on television, or golf players in a tournament). The highest ranked policies in the leaderboard can then be carefully relaxed until the total R approaches 1. A policy leaderboard could look as follows.
This is obviously a simplification of the real-world problem. Concerns about the budgetary costs of the policies for the government should enter, to avoid that the burden of our choices cuts too deep in the social welfare of the next generations (who will have pay higher taxes in the future and will receive less public goods and services from the government). This simple approach also neglects some dynamic aspects (there may be some path dependence in the sequencing of the policy choices as switching policies on and off has its cost as well).
A fundamental challenge to construct a leaderboard is to come up with an operational measure of social welfare W. Social welfare functions capture societal values and put them in an operational measurement tool. Ideally, they result from public debate and deliberation. Politicians, opinion makers, and members of the civil society play a crucial role to fuel that debate. Let me propose two principles that can be used to structure the search for an operational measure of social welfare W:
- Principle 1. A social welfare measure should be multidimensional. People care about their income, but also about other non-monetary aspects of their life (such as their health, social relations, freedom to move, job satisfaction, security, educational opportunities, etc.). This multidimensionality should be taken into account.
- Principle 2. A social welfare measure should give priority to the worst-off. Extra attention should be given to the fate of the worst-off individuals. Broader shoulders should carry more weight, especially in hard times. Hence, priority should be given to implementing these policies that improve the situation of the worst-off.
Looking at overall economic output or average income (measured by GDP per capita, for instance) as measure of social welfare is a possibility. In fact, it is the implicit position of many policy makers and researchers who focus on the effect of Covid-19 on the loss of GDP. Yet, this GDP-based approach does not satisfy the two principles listed above. It is neither multidimensional (it only considers the monetary aspect of social welfare), nor does it give priority to the worst-off (since GDP per capita is an average). Together with Marc Fleurbaey and Erik Schokkaert, I have made a proposal for an approach to measure social welfare that goes ‘Beyond GDP’ and is based on ‘equivalent incomes’, rather than standard incomes. The equivalent income of a person starts from her income, but takes into account how much she is willing-to-pay to eliminate sub-optimal outcomes in the non-monetary dimensions of welfare. Equivalent incomes can be used to measure the welfare of individuals to determine who should get priority in the social welfare function. This approach satisfies the two proposed principles and could be a starting point to compute the effect of relaxing policies on social welfare. On his website, Marc Fleurbaey and coauthors have provided an Excel sheet that can be used to experiment with some policy parameters for several countries: US, UK, France, Belgium, ...
We don’t have to wait for the estimates of advanced statistical models or sophisticated social theories to start ranking policies in the leaderboard. Some common sense about the effect of policies on social welfare and the reproductive number may help us a long way. Ideally, however, we are able to quickly complete the policy leaderboard based on real-world data. This task is of daunting complexity however, since we don’t know the precise effect of each policy on W and R. At this point, it seems that we have no other choice than to start from our common sense, to experiment in a careful and controlled way, and to learn from our mistakes as quickly as possible.
Scientists from different disciplines will have to join forces to complete the leaderboard. Virologists and epidemiologists are arguably best placed to quantify the impact of the policies on R (the second column in the illustration above). Social scientists, on the other hand, can describe and estimate the impact of the measures on the different dimensions of social welfare (the third column). To do that in an evidence-based way, a lot of new data is needed. We better start collecting and sharing these data in a creative and coordinated way. It is only by collaborating across disciplines that we can end the social distancing measures in a way that maximizes our social welfare with a minimal number of fatalities.
About the Author
Koen Decancq is Associate Professor at the Herman Deleeck Centre for Social Policy at the University of Antwerp.