Offshore ABL measurements for wind energy applications

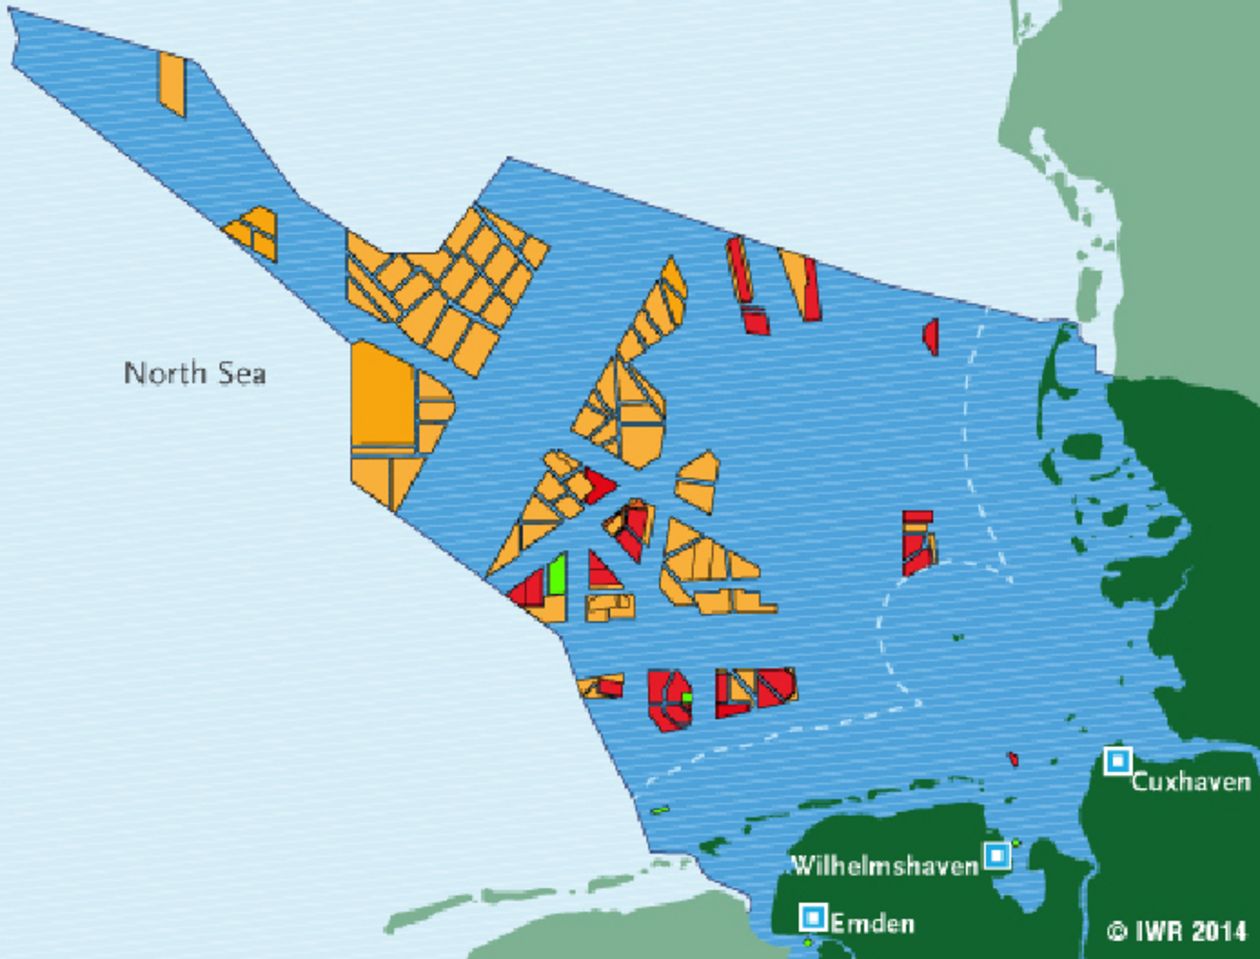
The North Sea has up to 40 GW of planned offshore wind energy generating capacity (Fig. 1;
www.offshore-windenergie.net; Bundesministerium für Wirtschaft und Energie). Therefore the wind climatology of the region is of great importance to resource assessment, and maintenance needs. The OWEA Loads project (https://www.uni-oldenburg.de/en/physics/research/we-sys/research/owea-loads/), managed by many partners across academic institutions and industry, has the objective of assessing the lifetime stresses and loads on current and future generation turbines.
The role of the Uni. Tübingen within the framework of the project, is to provide direct measurements of the atmospheric boundary layer, as close to the Alpha Ventus site as possible (Fig. 2), up to 500 m above sea level. The fieldwork was accomplished over 5 two-week campaigns, using our MASC UAV (link to page?). Requirements for UAV deployment are launch and landing sites, and line of site at all times is legally required during flight. Therefore a coastline was required; Helgoland (Fig. 3) was ideally positioned.
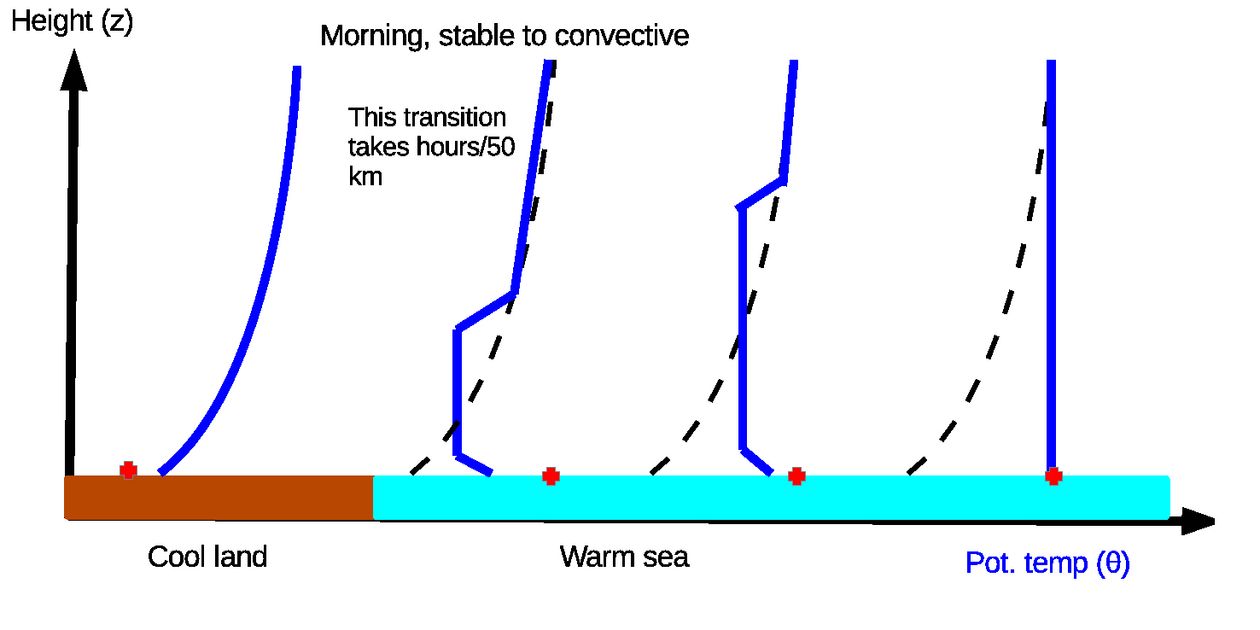
The results thus far show a large diurnal influence on the profiles of potential temperature, and therefore the profiles of stability, turbulence, and the mean wind speed. When an air mass moves from a cold to warm surface (e.g. land-sea in the morning; Fig. 4a), a convective layer develops, within which the turbulence intesity is large due to convective motions. Efficient mixing also causes the gradient of the mean wind speed to be small (Fig. 4b).
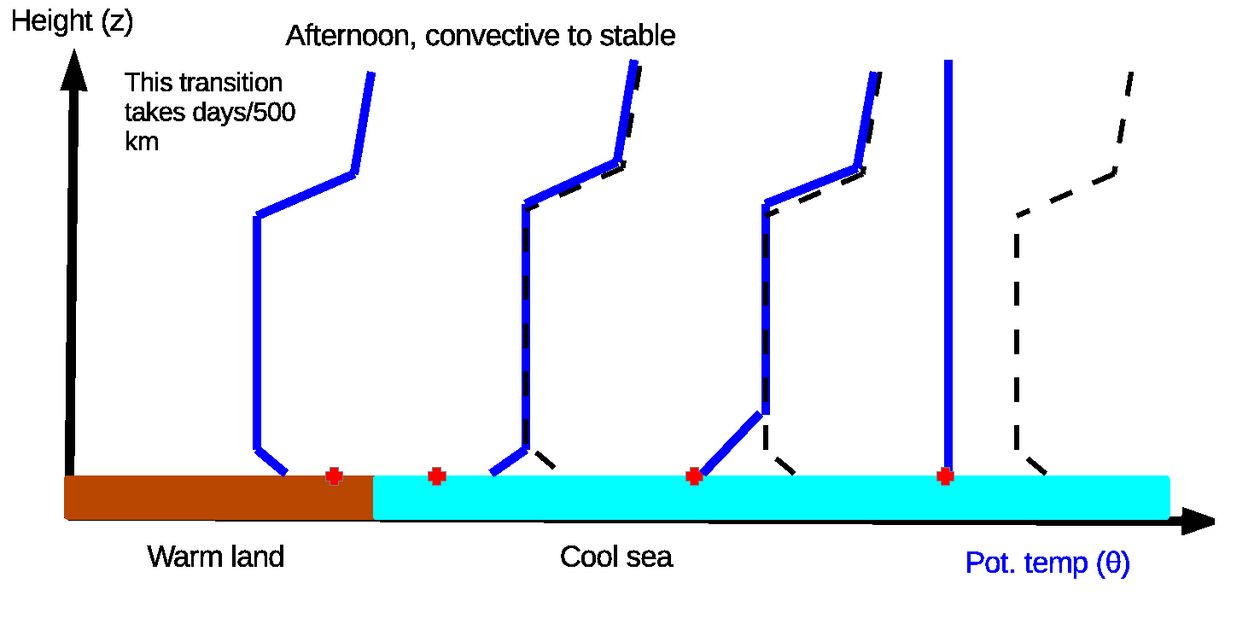
The effect of the transition from a warm to colder surface, (e.g. land-sea in the afternoon;Fig. 5a), has a very different effect on the wind profiles. The competition between turbulence being generated by friction near the surface, and destroyed by stratification, leads to a very shallow boundary layer, with strong turbulence in the lowest tens of metres, and a steep wind gradient (Fig. 5b).
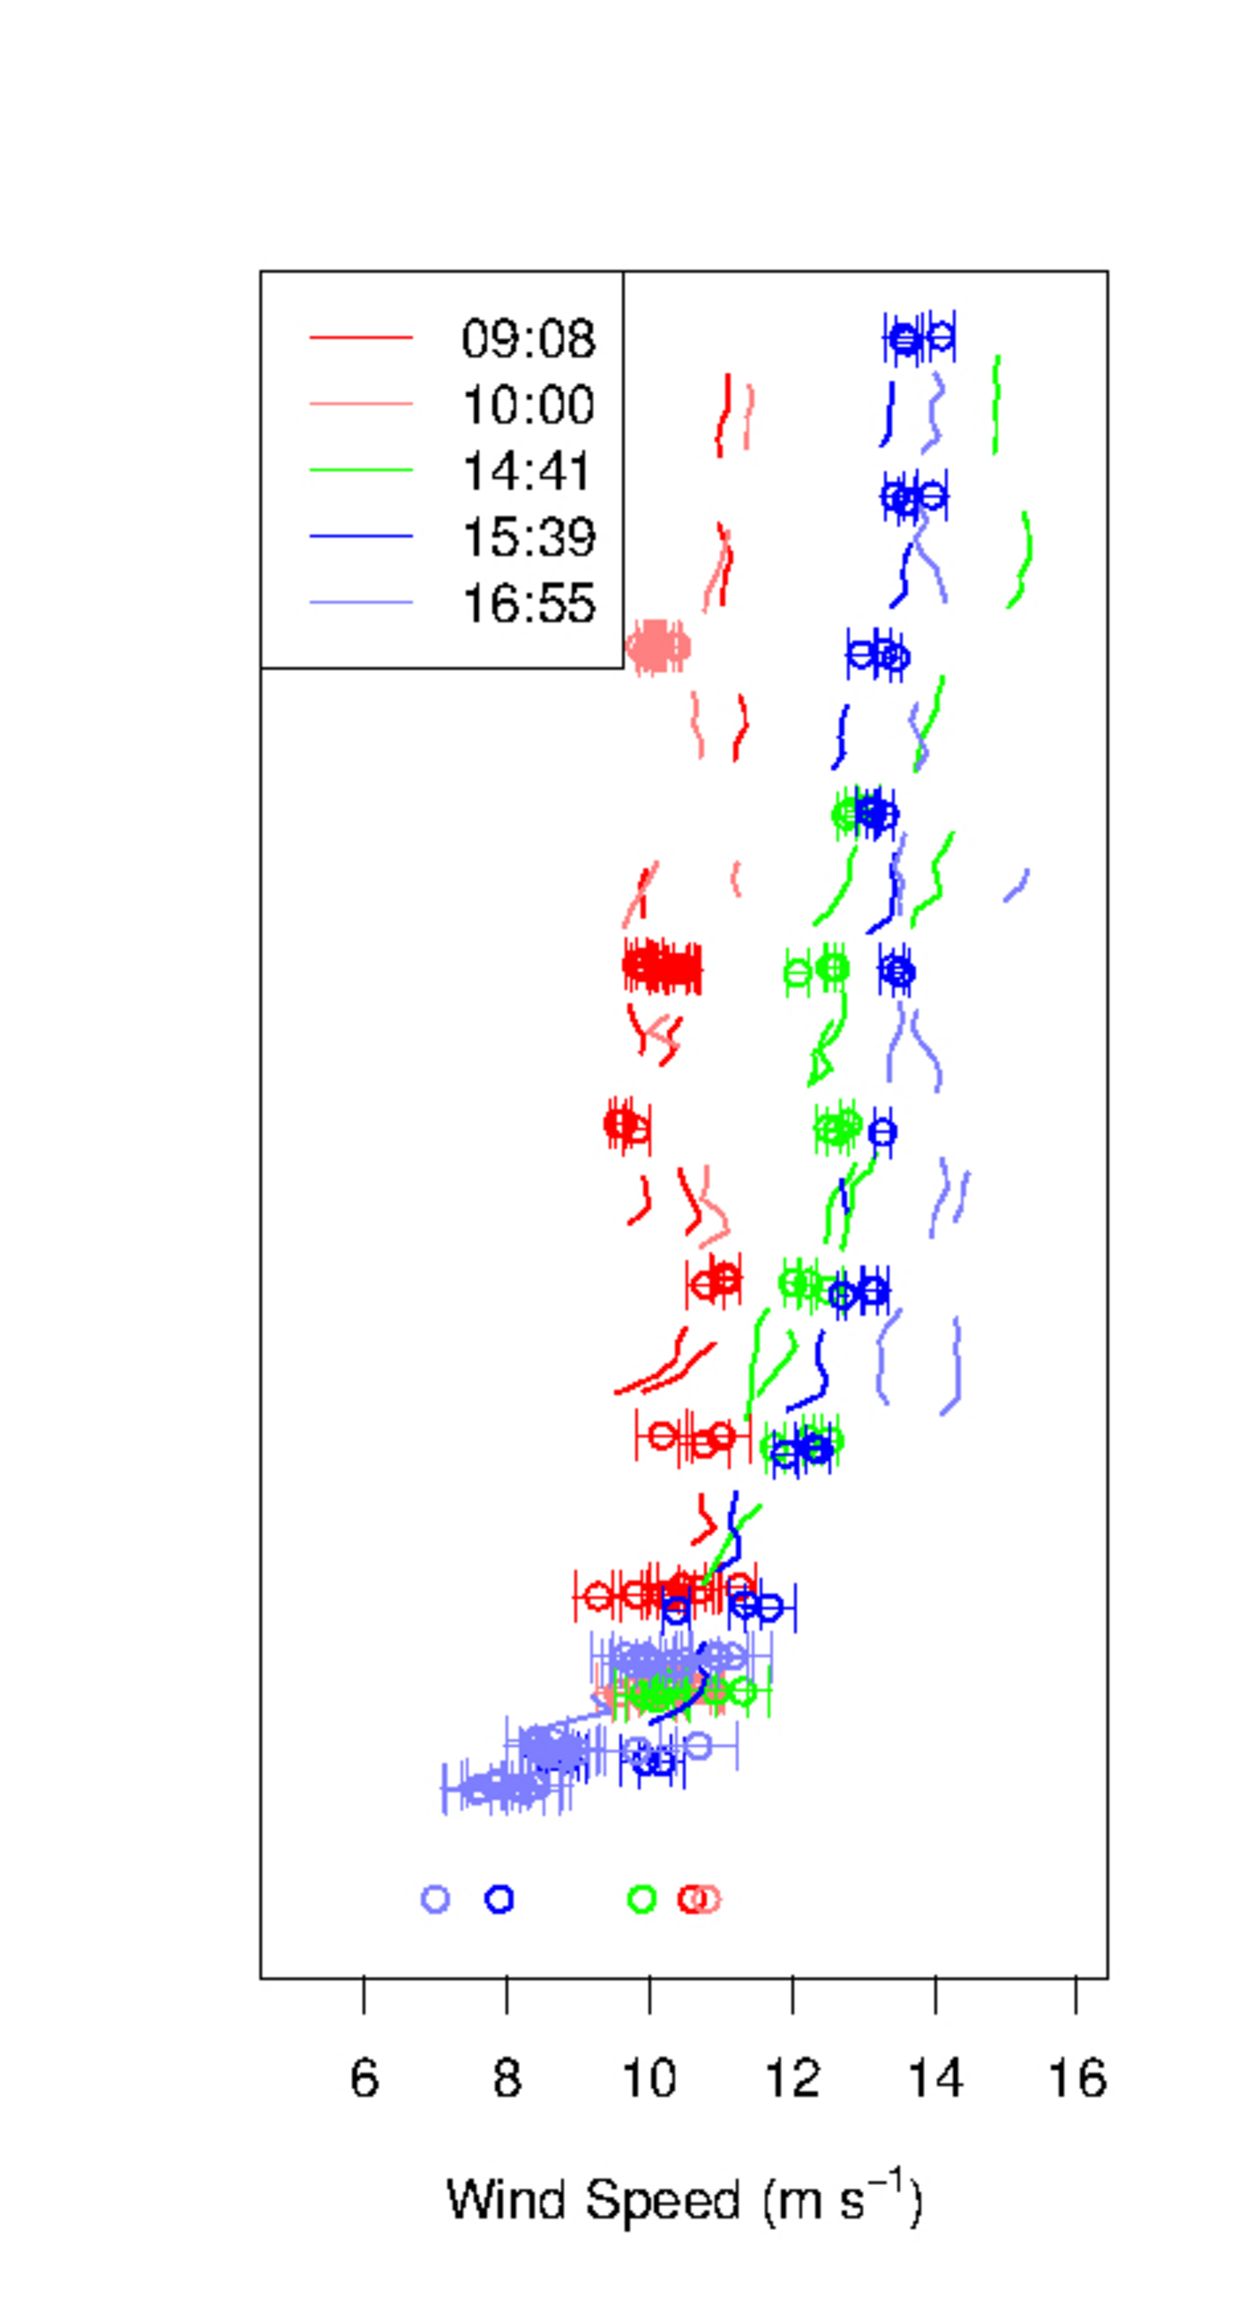
Understanding, and being able to model, these offshore thermal boundary layers in therefore critical to predictions of hourly, daily, and seasonal statistics of the mean wind speed and turbulence profiles. A measured example of the diurnal evolution over one typical sunny day with strong winds in October is shown in Figure 6a and b.
The current status as of Jan. 2016, is that measurements are all complete, about 80 flights mostly during winter due to restrictions on Helgoland, which is a special site for nature and tourism. Flight data are currently being processed, in preparation for the following analysis tasks.
- prediction of boundary layer heights, in terms of mean conditions and fetch (distance over water to the mainland). Comparison to literature
- normalised vertical profiles of turbulent statistics. Comparison to literature
- using the results of the prior two tasks, can the profiles of wind speed and turbulence be adequately modelled using knowledge of the mean conditions?
- use of measurements from a 300 m meteorological mast in Hamburg, to do an energy budget study. Using the change in thermal energy in the profile from mainland to Helgoland, can we indirectly compute the air-sea fluxes?
- use of numerical one dimensional models of stable and convective boundary layer growth, to compare measurements
- influence of low marine stratocumulus cloud deck on turbulent intensity