Fachbereich Informatik

ySocNet

In this project we developed a tool to analyse and visualise social networks. A social network in this context is a graph, in which nodes represent actors and edges represent relations between these actors. An actor could be anything, like for example a person or a company. A relation could then be like/dislike or information-/cashflow. We concentrate on the mathematic representation of actors and relations. The definition of relations and actors is done by social scientists before starting the mathematical analysis. The analysis of such a graph can provide information about the grouping structure and the "importance" of single actors.

Features

  • easy to use graphical interface for data input and analysis
  • variety of centrality functions 
  • powerful grouping algorithm 
  • wide variety of layout algorithms provided by yWorks

Thesis

The program ySocNet was part of a master thesis. The thesis can be downloaded here: [.ps.gz] [.pdf]

Manuals

Download

  • ySocNet needs java1.2 or higher. For Java visit java.sun.com 
  • Download [.jar] Press Shift, when clicking on the link, and remove the ".txt" ending that your browser might add

Screenshots

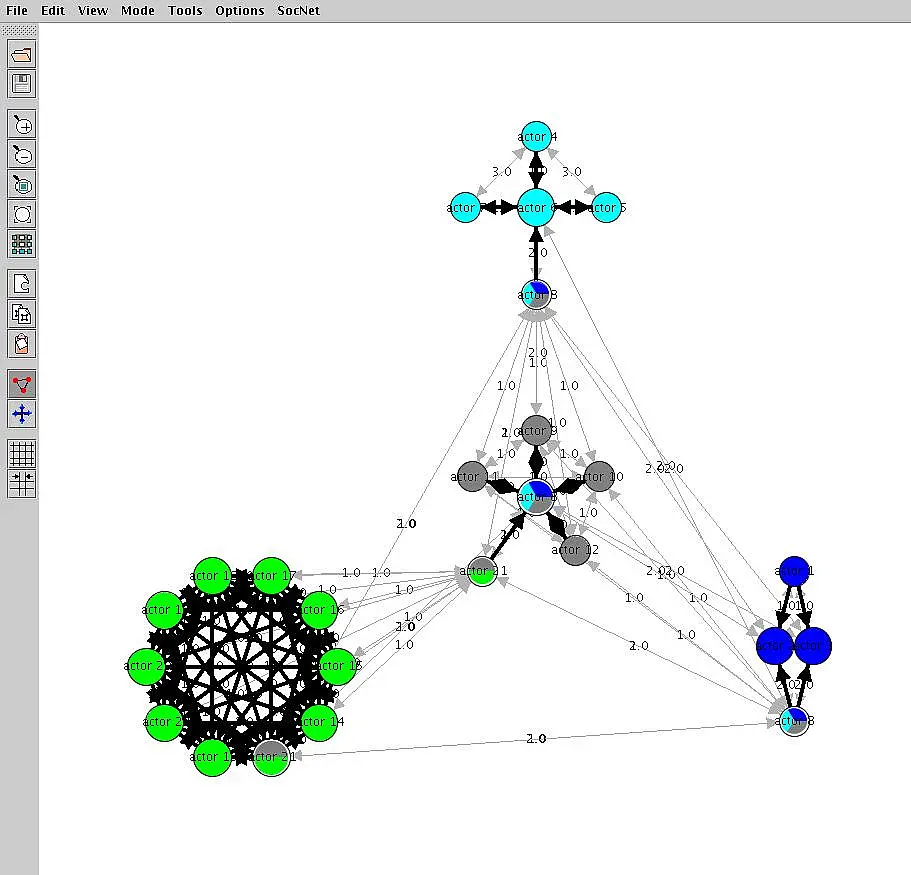
This screenshots shows the result of the analysis of a social network, in which we have several groups, indicated by different colours, which share actors, indicated by sharing the colours of each group they are in. Actors, who are part of more than one group are often called bridges and may play an important role in group-communication. The size and position indicates the importance, or centrality of an actor. The further an actor is from the centre of the group, the less important the actor is. In the green group every actor is equaly important. Thanks go to Monika Lanik from the Ethnological Institut Tübingen, who was friendly enough to provide the data for this analysis.