Motif Mapper algorithm Cluster Analysis Real Randomziation short tutorial
The current version is incoporated into Motif Mapper and can be downloaded here:
- 5.2.4.01 (.NET version with full GUI interface, GFF promoter parser, Significant Motifs in Promoters)
The algorithm “Cluster Analysis Real Randomization” allows one to test sets of gene lists for cis-element motif enrichment or depletion against a (preferably) genomic background. The single FASTA file is the genomic background and the same source file for the gene lists. In other words, the FASTA file should be a complete genomic set of promoters from which the specific gene sets are taken and from which the background counts and randomizations are made.
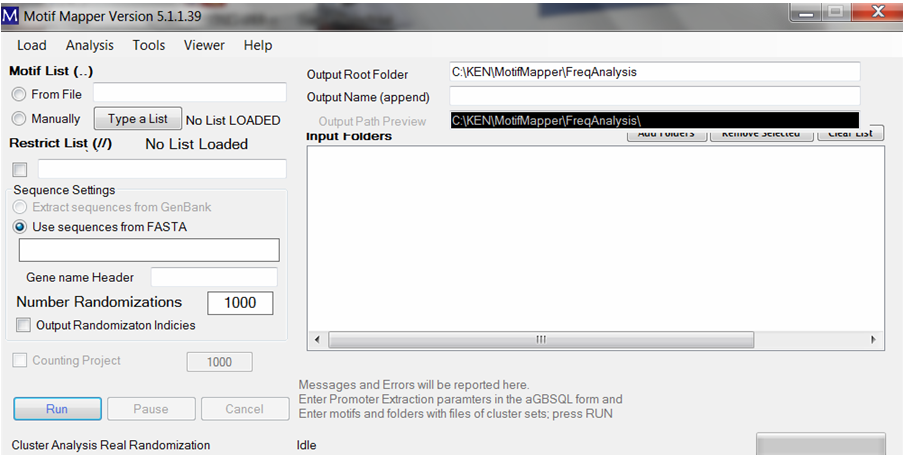
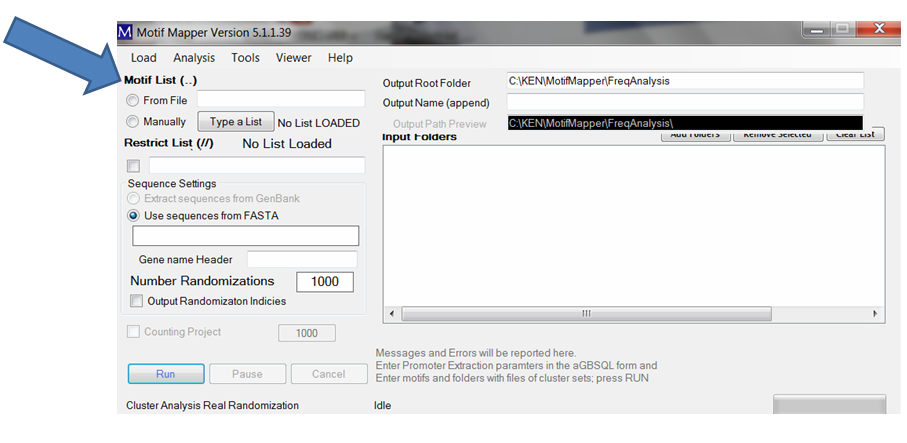
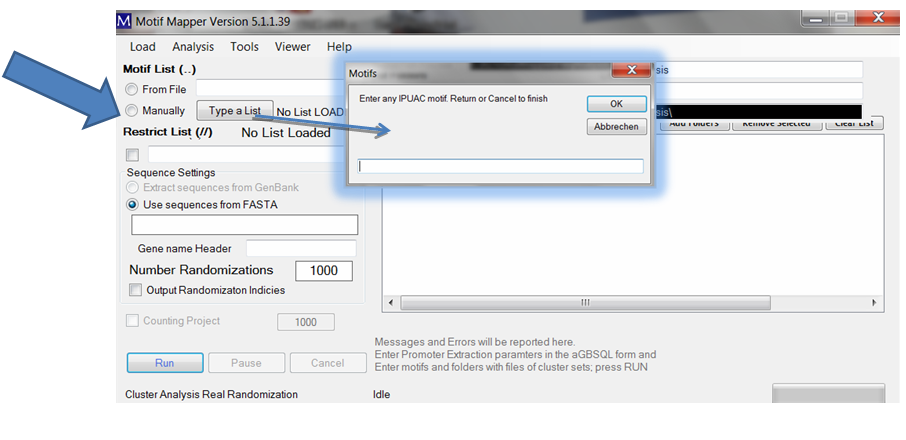
Cis-element motifs can be entered in two ways. One, one can enter a list manually using the “Type a List” button. Motifs will be automatically search in both Watson and Crick words. Composite motifs (more than one with fixed or variable spacing between binding sites) are translated into all Watson and Crick word combinations without altering the motif order.
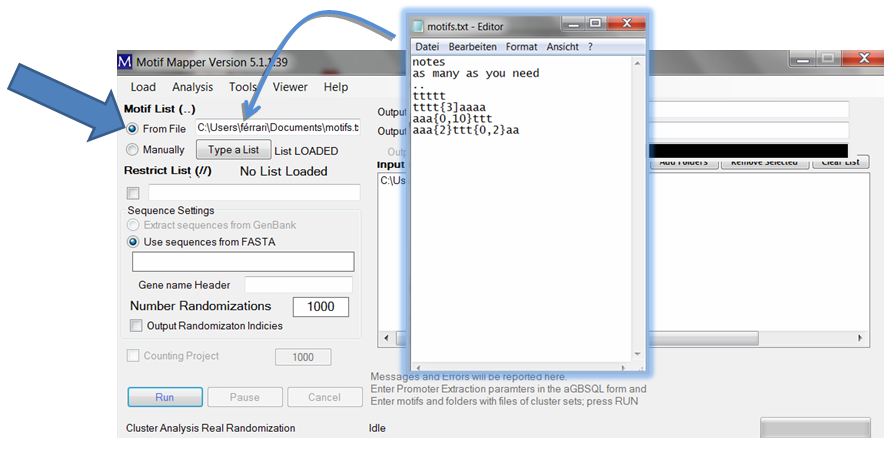
A small window opens where you can enter as many motifs as desired, one at a time.
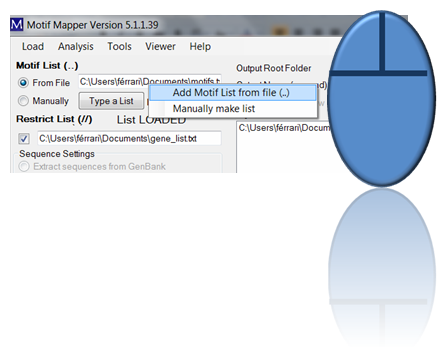
Two, one can enter a list of motifs (as long as wanted) by loading a file. The file should be a text file. It may have a header of any length which is ended with two dots on their own line. After that, each line is assumed to be a motif. Emtpy lines are ignored. To load: drag and drop the file into the text box or use the right click in the text box and ...
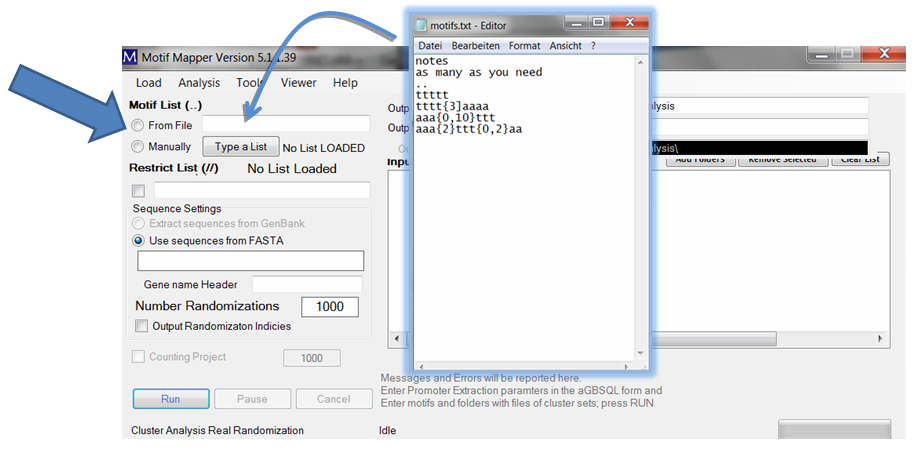
... a menu opens up that allows one to choose files using a file browser.
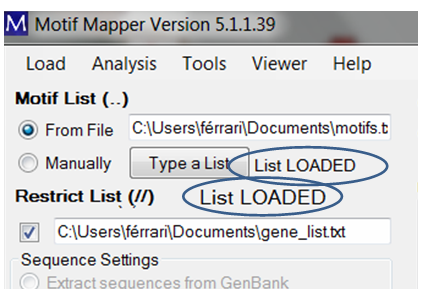
If a valid list has been entered, then “List LOADED” will be shown.
The same procedure goes for gene lists. A gene list can be entered to restrict or limit the sample space of your FASTA file to only those in the gene list in the Restrict List text box. A gene list header is divided with a line containing two forward slashes “//”.
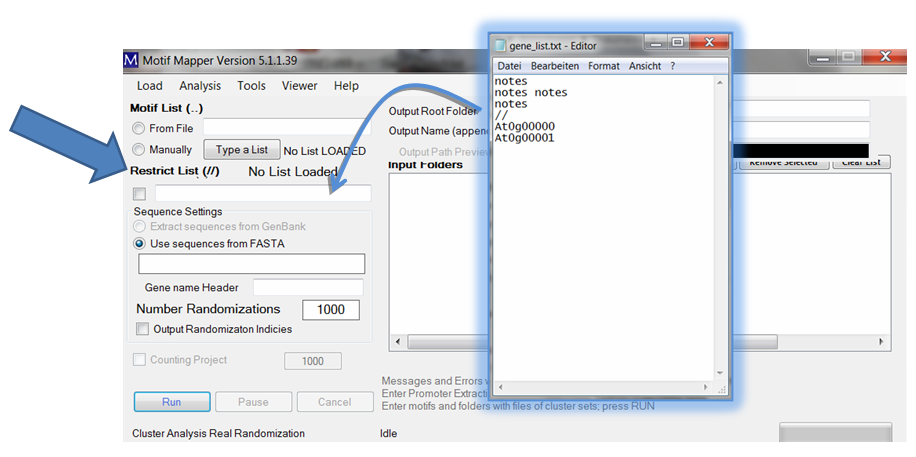
For the example, a valid list will be indicated with the message “List LOADED” displayed.
To set up gene lists, you provide your gene lists as text files in a folder. That folder is then “dropped” into the Input Folders list box. All valid files (txt usually; see Motif Mapper help for more) are read in automatically. You can add as many as you want. The results will be returned for each separate text file, and therefore each gene list, in a new folder under the Output Name (append).
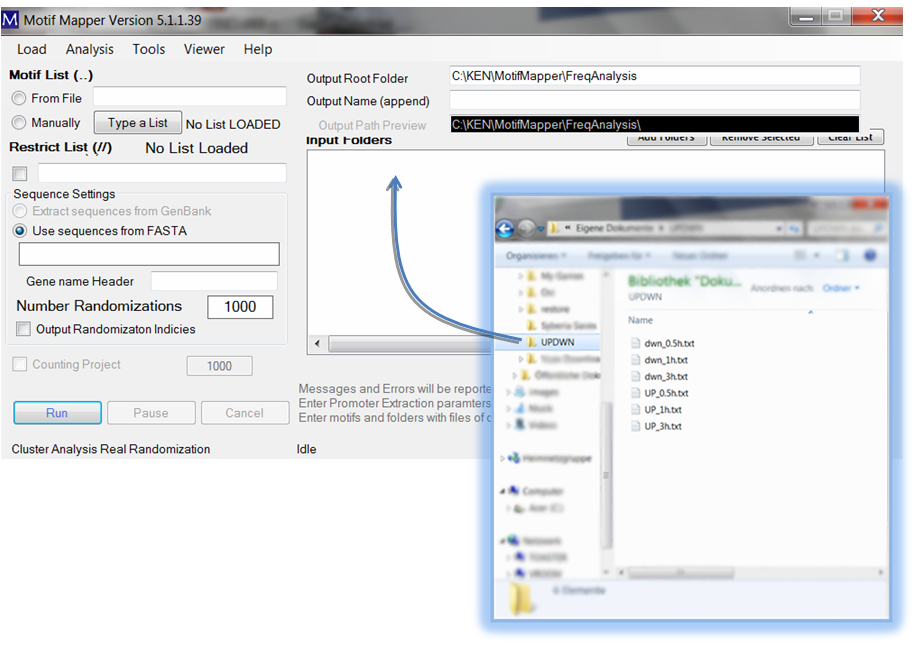
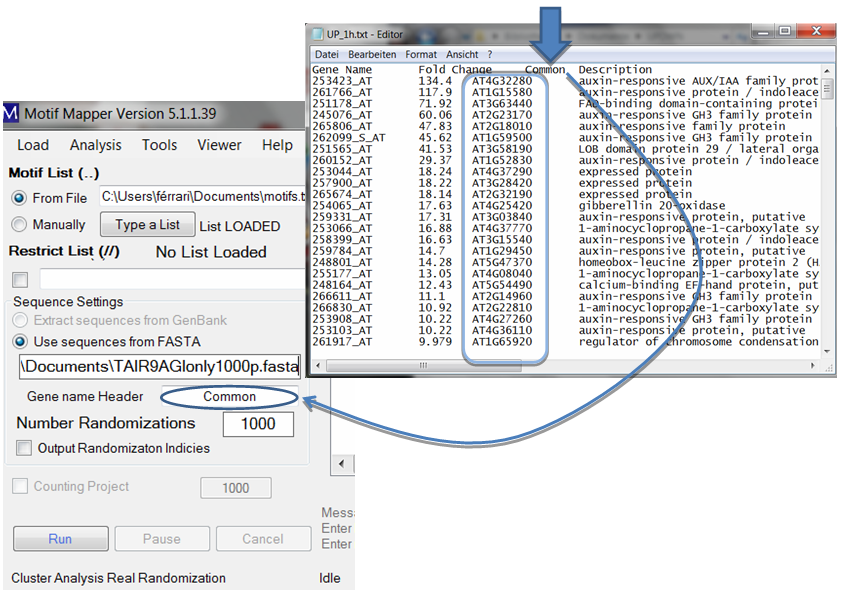
The gene list text files require only one thing: there should be a column, with a column header, and below it the list of Gene IDs that match exactly the Gene IDs in the FASTA file. The column header should be typed in the “Gene name Header” text box, capitalization is ignored. The gene list file may be a tab-delimited file with multiple columns; the appropriate column will be automatically found.
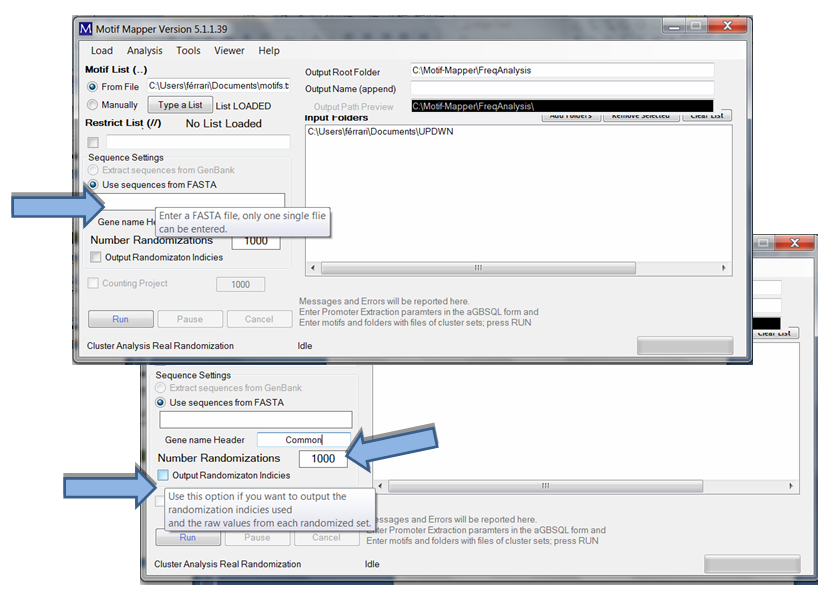
Keep in mind that only one FASTA file may be entered. The user has the option to return the Output Randomization Indices to check, or confirm, that the randomization was sufficient enough. Normally, a novel user should do this once to understand the data calculation and to be secure with it, after that, it is unnecessary.
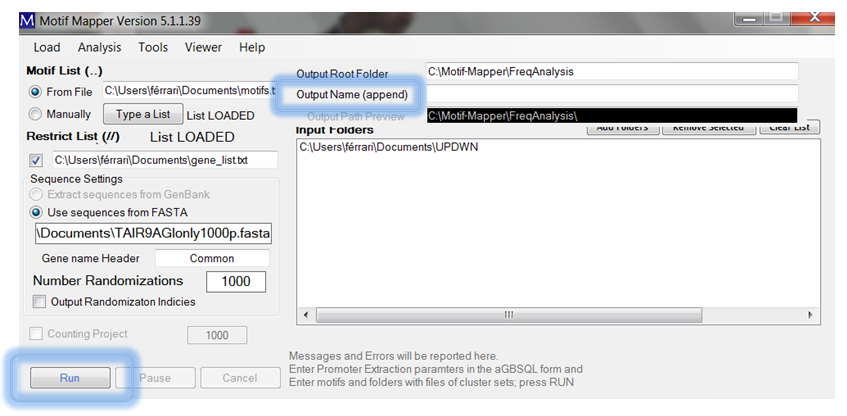
Finally, don’t forgot to give the sample run and descriptive name in the Output Name (append) text box and the click RUN. The program will load the FASTA file and begin mapping all of the motifs in the entire dataspace first. This can run over-night if there are many motifs, or many composite motifs. Afterwards, the randomization begins specified for the number of times given in Number Randomizations with random sets of genes with the same size as the experimental gene set. P-values are returned using a Z-score comparing the experimental dataset to the average randomized background; p-values ≤ 0.02 nominally have a false-positive error rate of 0.05 or less.
Explanation of How the Algorithm works and example output
You need to construct or download the promoter sequences from an entirely sequenced genome and save these in FASTA format. (Explanation of where to input this is given above).
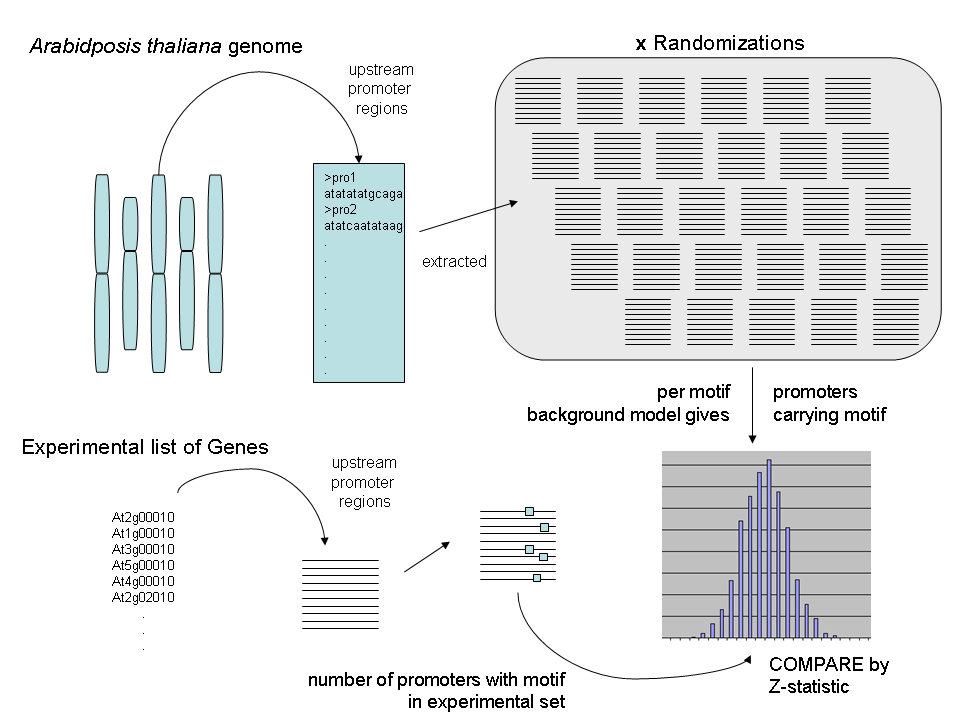
The algorithm makes random sets of promoters the same size as the group of genes and calculates the four parameters (explained below) for that set and then repeats the process for the number of repetitions defined by the user; for example, 1000 times. Once this has been done, those four parameters are calculated for your specific set of genes and then compared to the randomized distribution by a z-statistic.
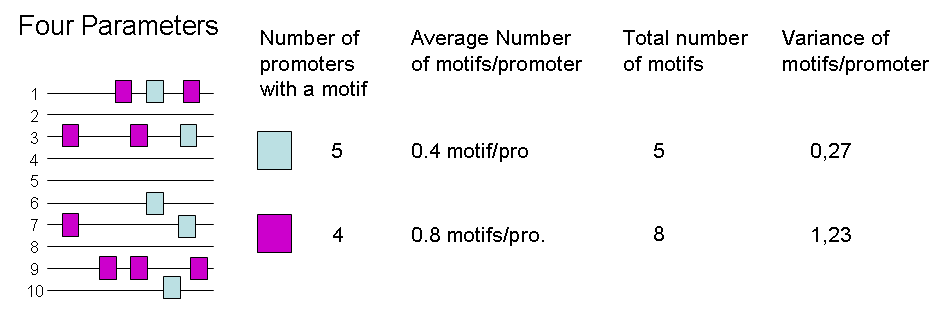
The four parameters are defined as follows: (1) The Number of Promoters with a Motif; (2) The average number of motifs/promoter for the entire group; (3) The total number of motifs in the group; (4) the variance of the average number of motifs/promoter.
The actual output are (tab-delimited) text files that are most easily read in any spreadsheet application. After you open the files in a spreadsheet application you can easily peruse your data.
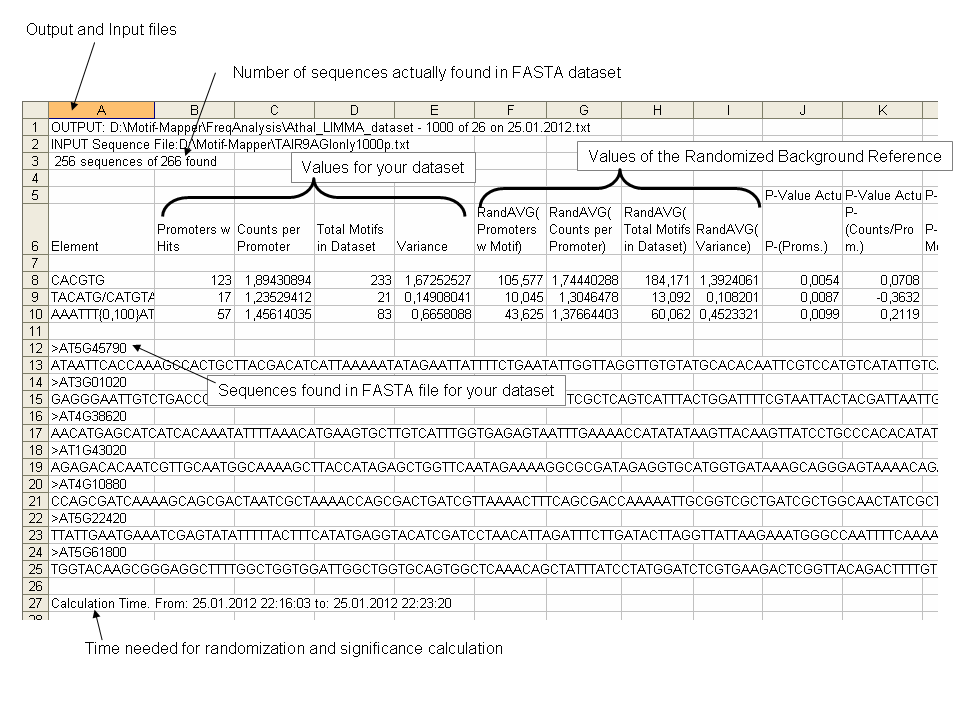
As can be seen in this example, you are given a list that goes element by element for each of the four parameters for the gene group and then the average from the randomized data. You also are told which input and output files the data belong to for reference. The sequences found in the FASTA file for your gene group is returned in the same file after the motifs. And finally, at the very bottom is the time needed for the randomization and calculation for that gene group.
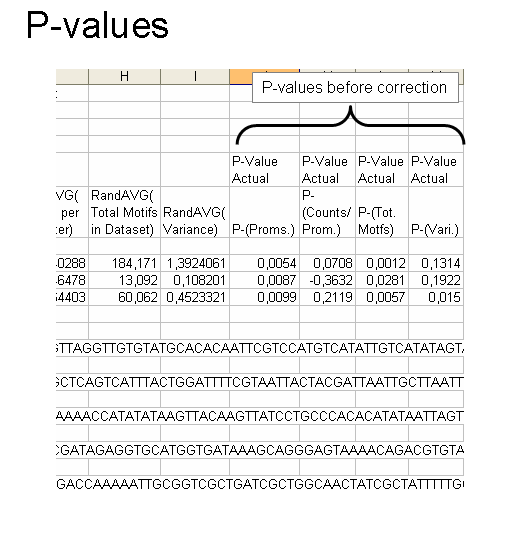
The final 4 columns are the p-values for motif enrichment (more than the randomization mean) or depletion (less than the mean). The first four are of the actual p-value found by making the gaussian z-statistic. If you are testing multiple cis-elements, keep in mind you will need to make multiple testing corrections.
Randomization Output
In case the user would like to check the z-statistic or test the data for normality, the program also returns two files: (1) the Random Index and the (2) Set Values. This is an option (see explanation on running the program above) in the program which is outputted to a child-folder within the main output folder.
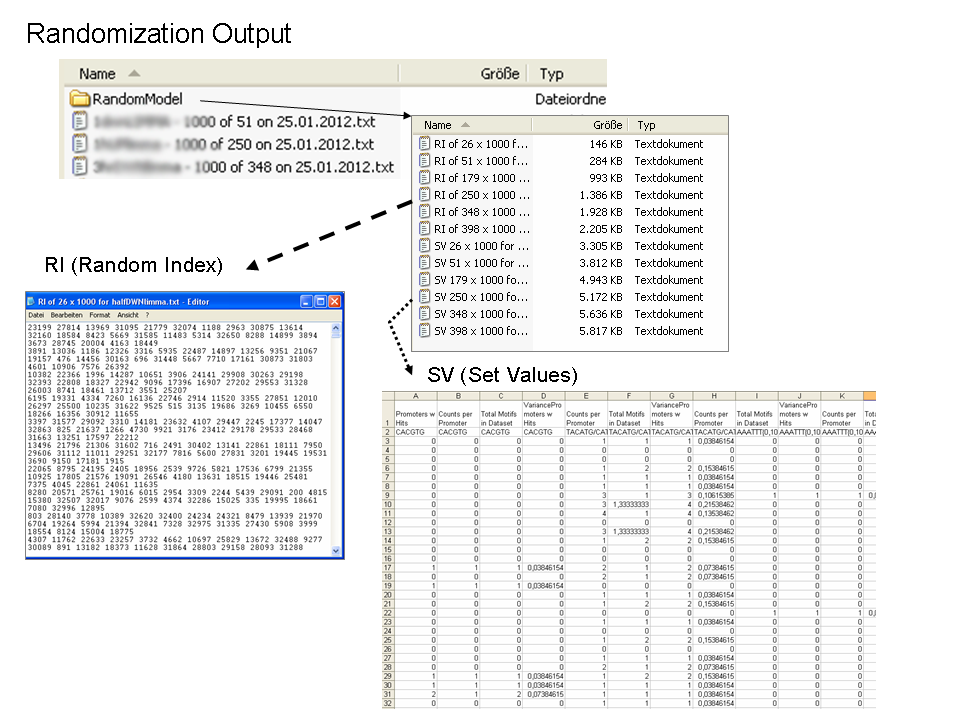
The Random Index (RI) is the internal number given to each sequence in the FASTA file. These are the sequences then used for making each random group. As this is repeated x (e.g. 1000) times, the user gets a list of y number of indices (equal to the specific gene group) for x number of times.
The Set Values are the numbers obtained for each random group for each of the four parameters for each motif. In the figure above, this file has been opened with a spreadsheet program. There are x number of values that correspond to the x number of repetitions of the randomization. This are the values that one needs to check with their own statistic if desired or other tests, for example a normality test, if they feel so.