Institute for Astronomy and Astrophysics

Development of UV MCP Detectors

Principle of the Detector

We develop photon couning imaging detectors for the ultra violet spectral range. A UV sensitive photo cathode releases photo electrons. These are amplified by micro channel plates (MCP) into an electron avalanche, which hits a cross strip anode as charge cloud. This cross strip anode comprises 64 strips for the X direction and 64 strips for the Y direction. The strips are arranged in such a manner that the X strips and the Y strips receive the same amount of charge. The 128 charge signals are fed into a BEETLE chip, which amplifies and registers them. The signals are then further processed by an FPGA. As an electron cloud hits several strips, a centroiding algorithm can determine the original position of the photon down to a fraction (1/32 or 1/64) of the distance between two strips.

Cross Strip Anodes

2 versions of cross strip anodes were manufactured: A rectangular version with an anode size of 33mm x 44mm and a squared version with an anode size of 39mm x 39mm. The anodes were manufactured by VIA electronic.

BEETLE Chip

The BEETLE Chip is used for the readout of the anode signals. It is a development of the ASIC laboratory of the University of Heidelberg and the Max-Planck-Institute for Nuclear Physics in Heidelberg. It is mounted onto a hybrid module made from LTCC by micro-Hybrid according to our needs.

FPGA and Detector Test Stand

Control and readout of the BEETLE chip is done by an FPGA (field prgrammable gate array), a programmable digital electronics chip. This FPGA is connected to a windows PC via USB connection. A space flight version might also use a space wire connection. The detector test stand comprises a vacuum chamber which houses a modular detector system. This detector system may easily be modified. Thus it is possible to test different detector and readout configurations.

Visualisation of Beetle Data

The adjacent image shows a visualisation of data, as they are read out of the BEETLE chip:

The X axis shows all 128 BEETLE channels. Channels 0-63 carry the signals of the X strips and channels 64-127 carry the signales of the Y strips. The Y axis of the image shows the time information: The data are aquired with a frequency of 40 MHz, thus the vertical distance between two pixels corresponds to 25 ns. Each MCP event triggers the aquisition of data by the BEETLE chip, which registers 14 successive values (samples). Between two adjacent events the image shows 2 black pixel rows to seperate the individual events. Thus the image shows the development of the pulses in space and time, simultaneous for the X and Y strips.

Currently the raw data are transferred completely to the computer, where they are saved for later analysis. For data reduction all samples of an event are added up andthe centroid of the carge distribution is determined by gaussian fits, seperately for the X strips and Y strips. In future the centroiding shall be done within the FPGA with an optimised algorithm.

The lower image shows the image of a test mask, reconstructed from the recorded data.

Resolution Tests

Here a reduced lens imaging of a test mask is seen. The data reduction algorithm determines the center of gravity of the charge distributions in X and Y direction down to 1/64 of the strip distance. This corresponds to a pixel size of about 11 µm, the image has a format of about 3000 x 4000 pixels (rectangular anode 33mm x 44mm).

The other two images show more detailed cutouts of this image. The smallest test mask strips that can be resolved have a distance of about 5 pixels, corresponding to 55 µm. The imaging quality is also limited by lens abberation.

Flat field measurements

These images show a flat field image (size of raw data file: about 164 GByte!). The horizontal and vertical strips visible in the image are artefacts resulting from some low gain or unconnected BEETLE channels. Additionally there can be some bright spots and dark spots seen on the MCP surface. These are imaged with good resolution, as well as the borders of the MCPs.

New Tests of Geometry and Resolution (2018)

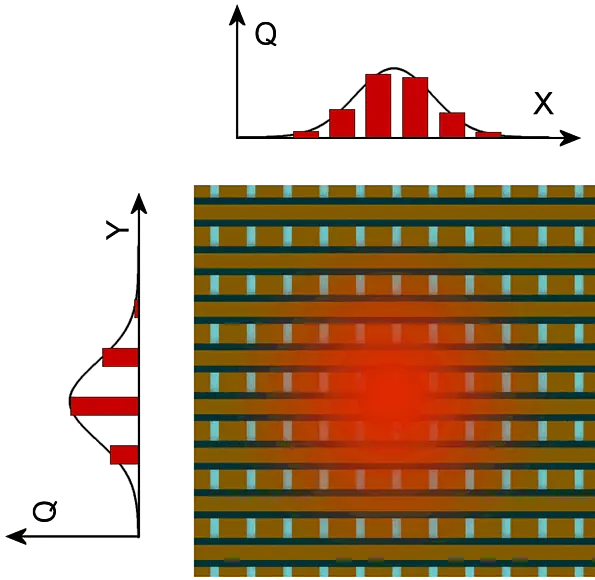
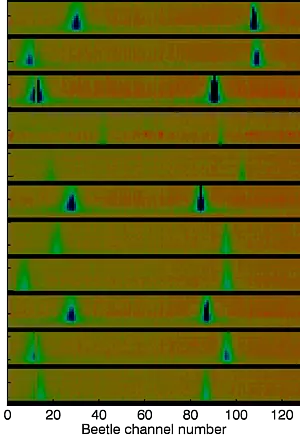
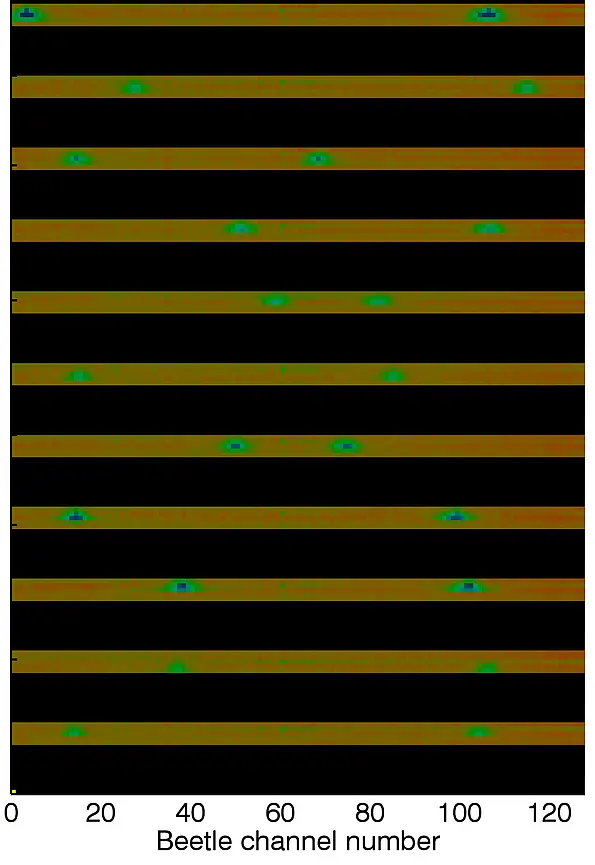
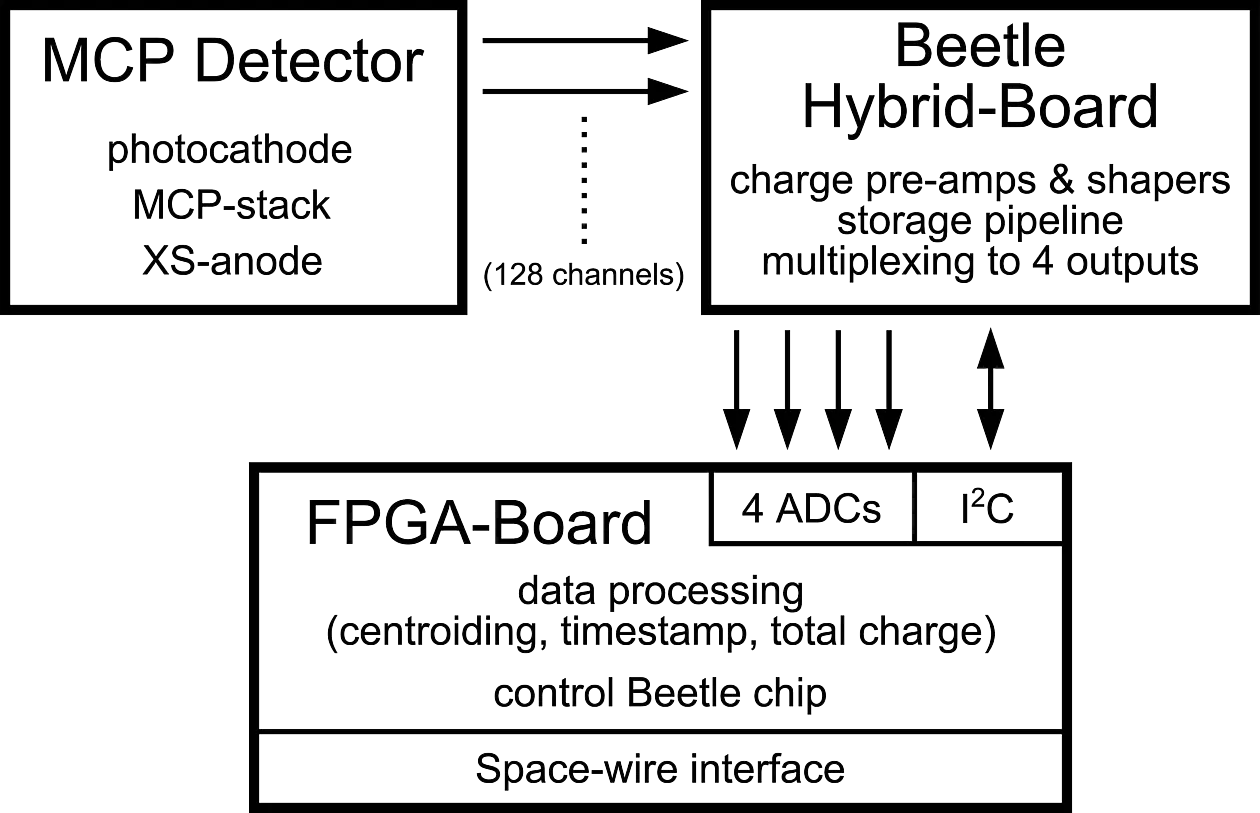
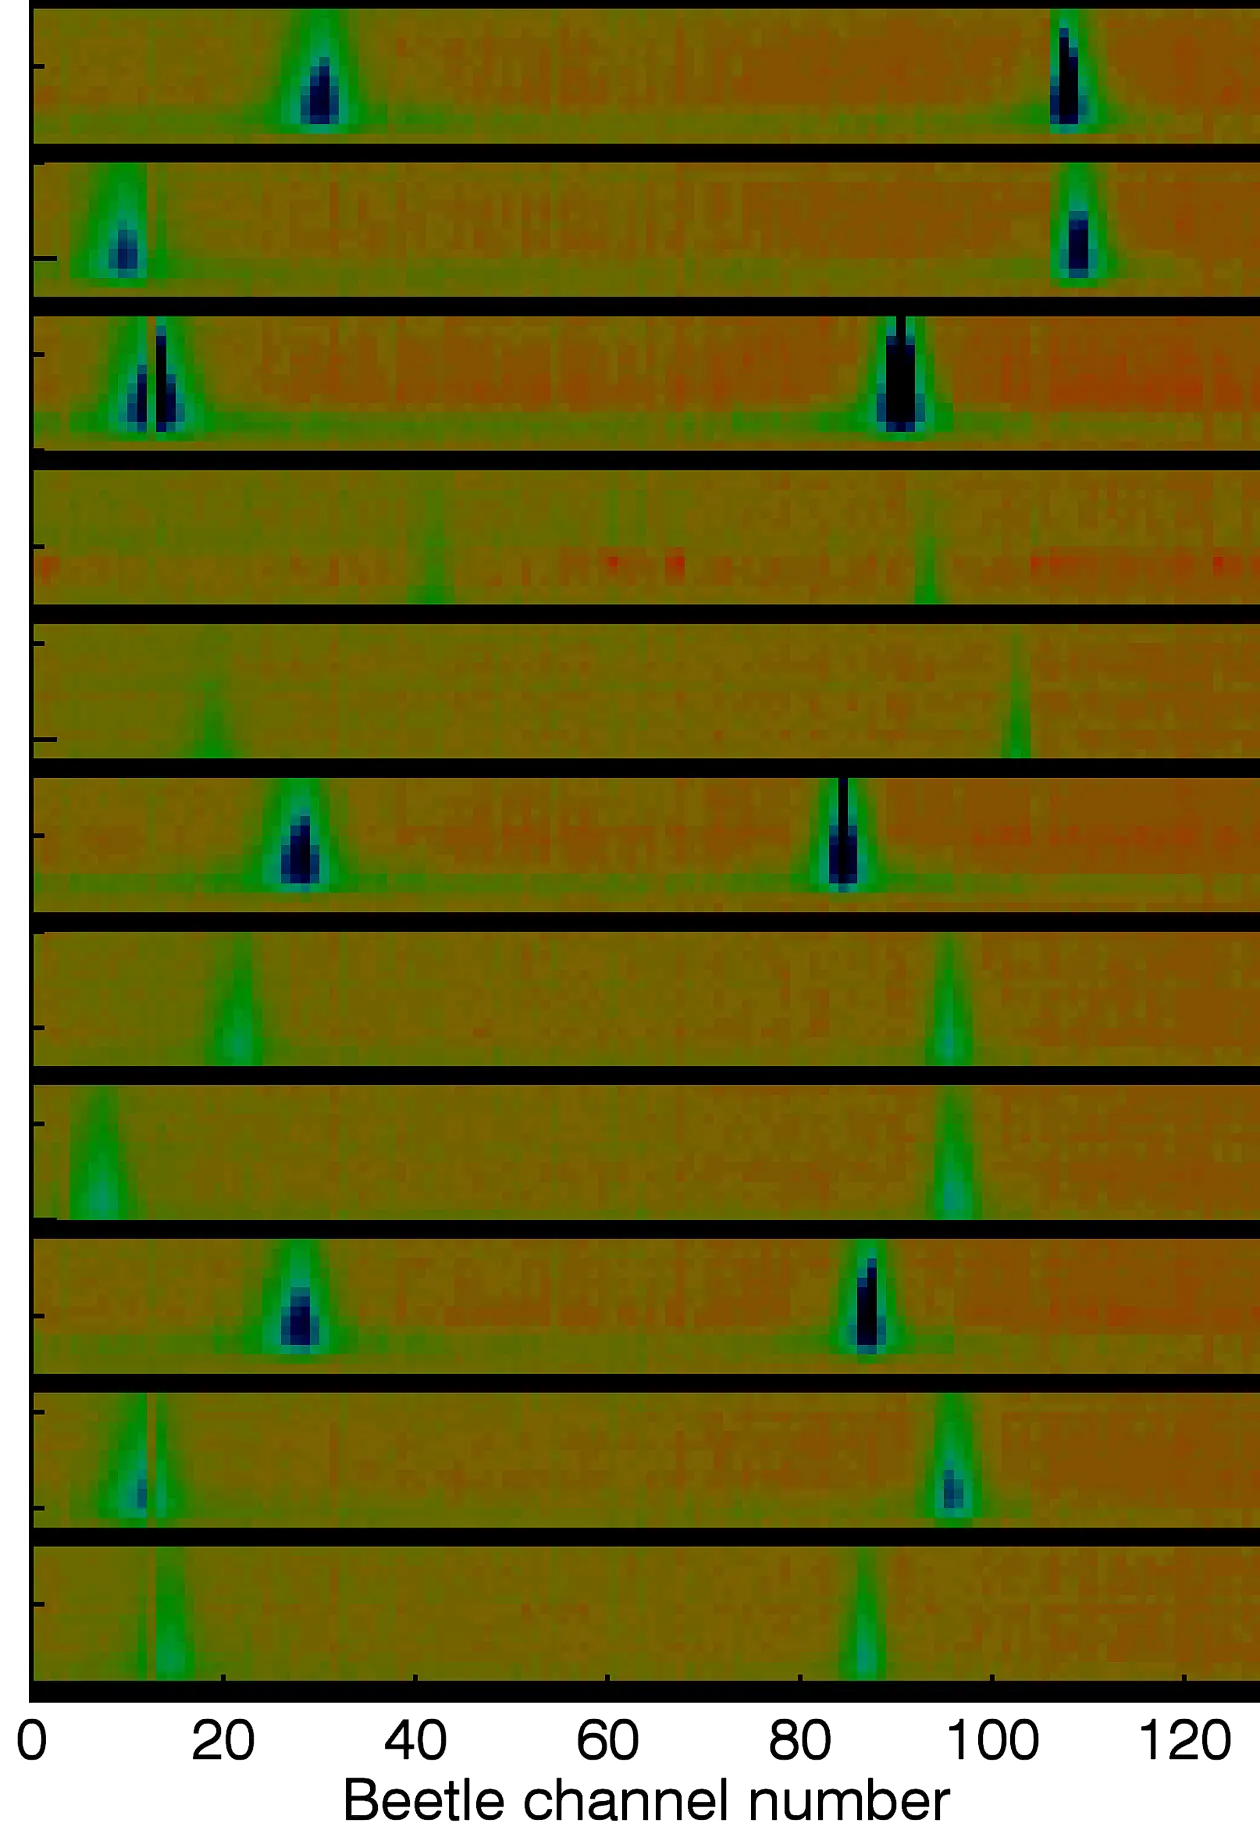
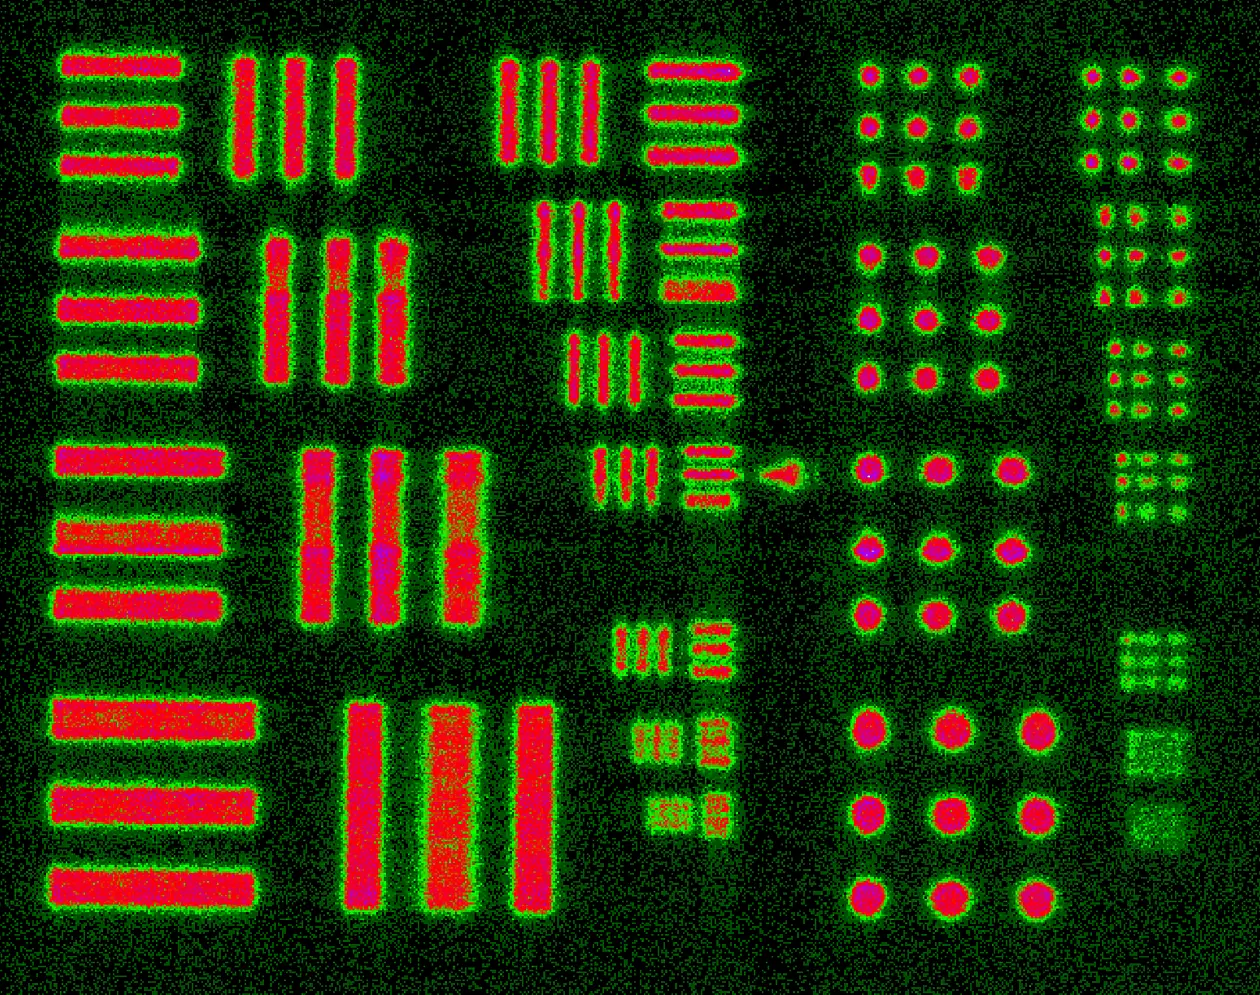
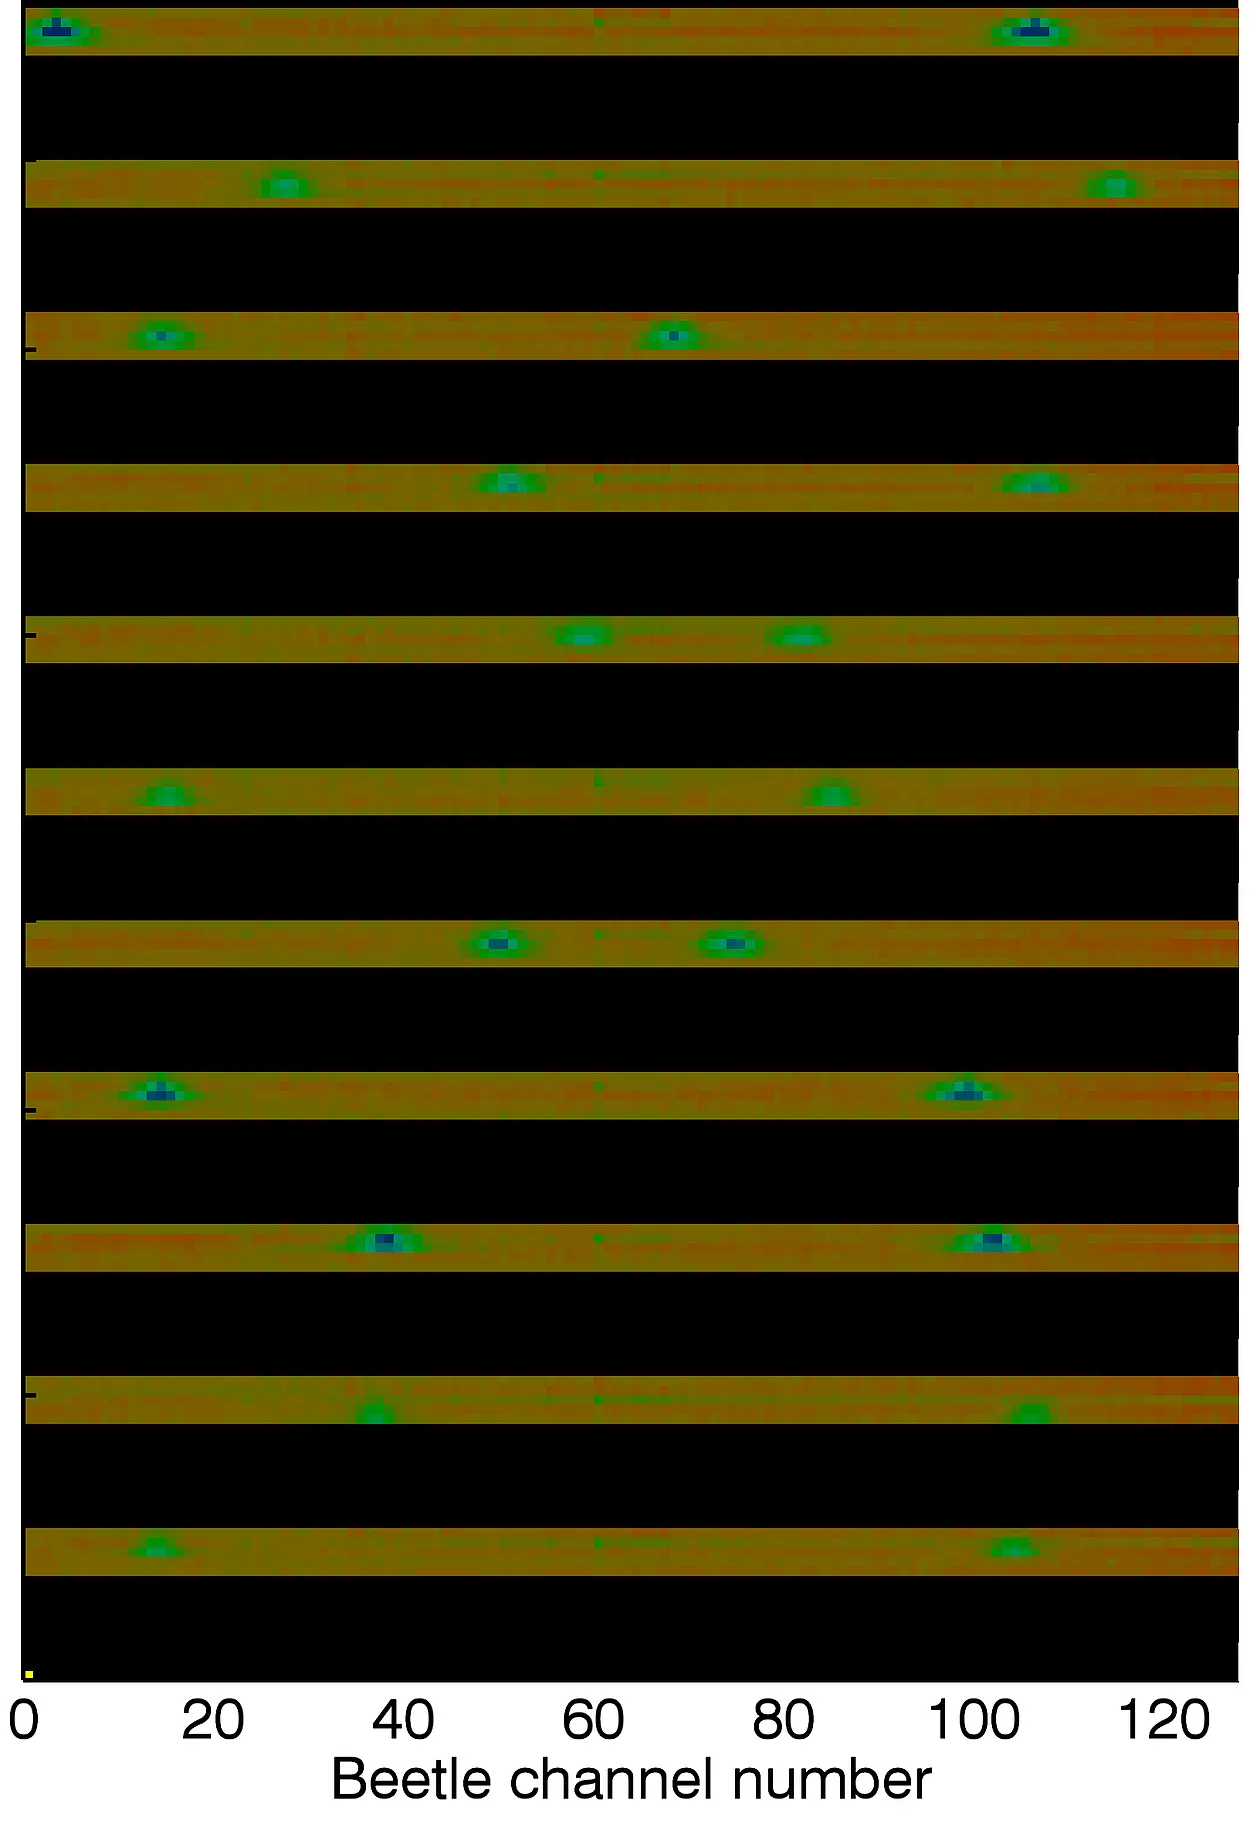
The parameters of the Beetle-Chip were optimized in 2018, resulting in shorter pulses which can now be registered within 5 samples. The first image shows a visualisation of the Beetle pulses: The X axis shows all 128 BEETLE channels. Channels 0-63 carry the signals of the X strips and channels 64-127 carry the signales of the Y strips. The Y axis of the image shows the time information: The data are aquired with a frequency of 40 MHz, thus the vertical distance between two pixels corresponds to 25 ns. Each MCP event triggers the aquisition of data by the BEETLE chip, which registers currently 5 successive values (samples). Between two adjacent events the image shows 11 black pixel rows to seperate the individual events. Thus the image shows the development of the pulses in space and time, simultaneous for the X and Y strips.

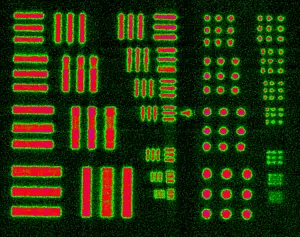
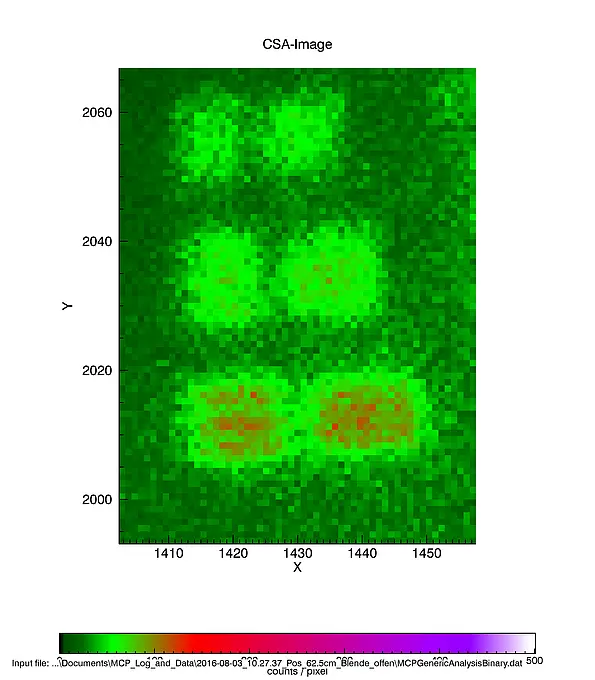
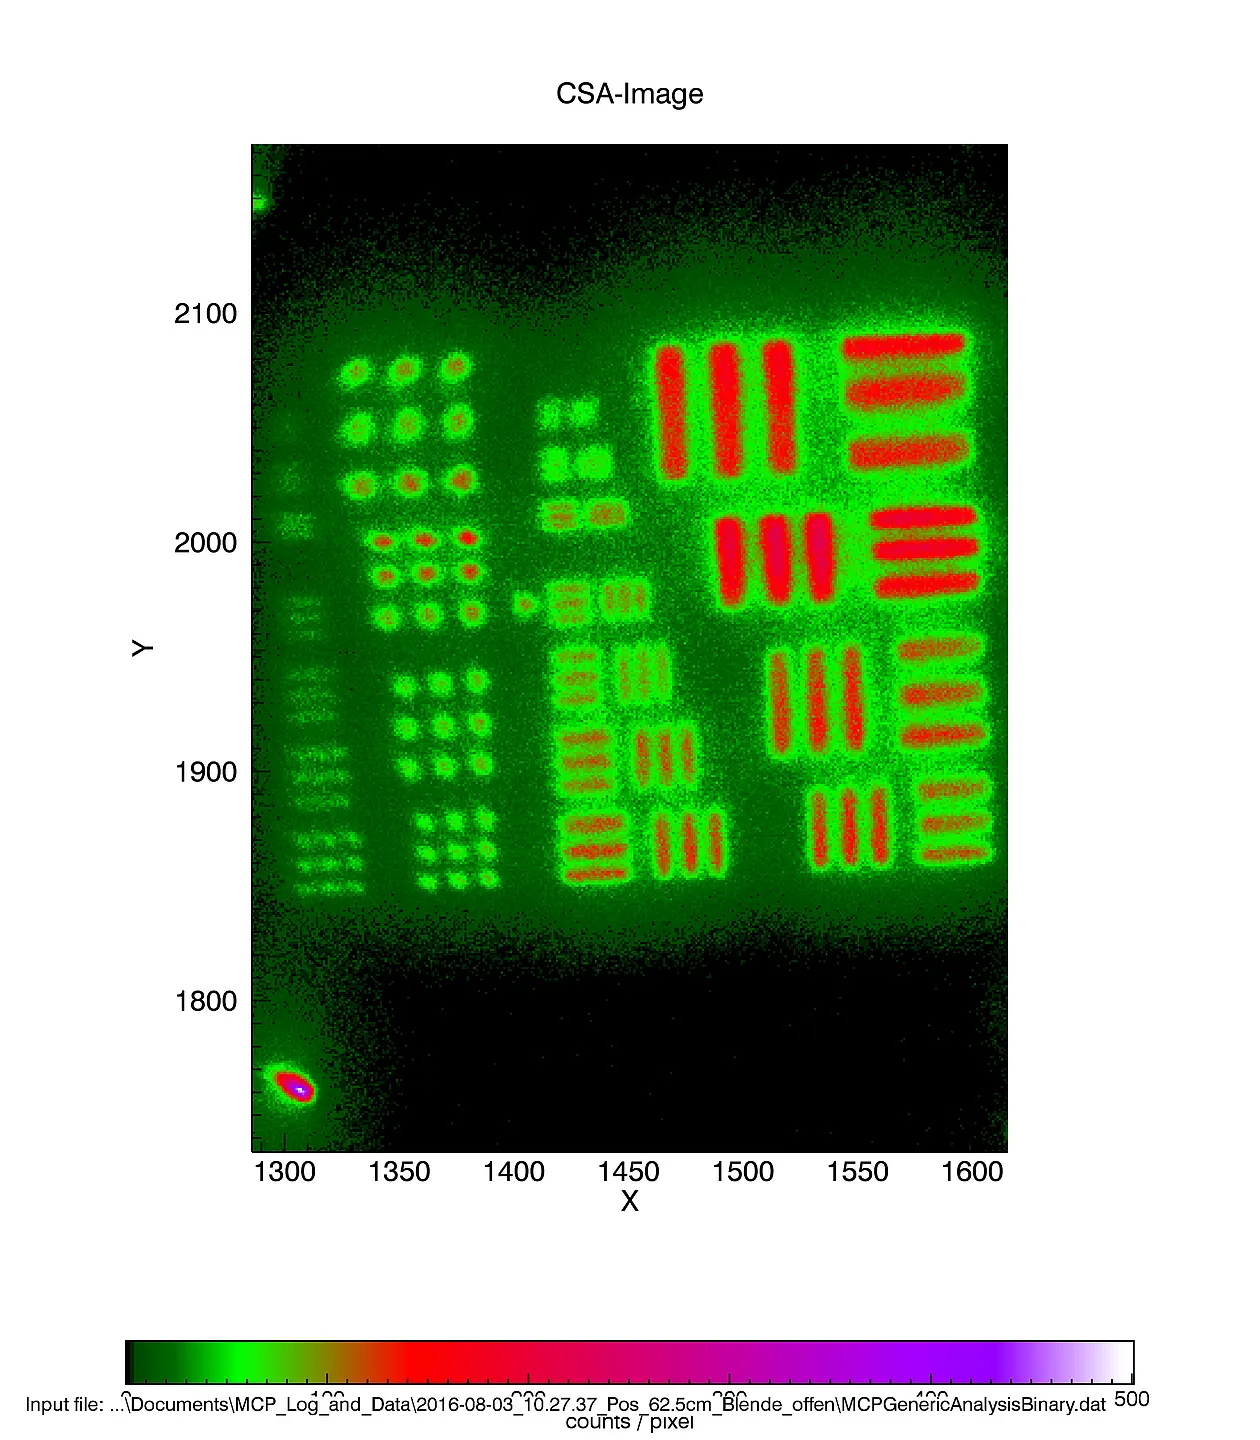
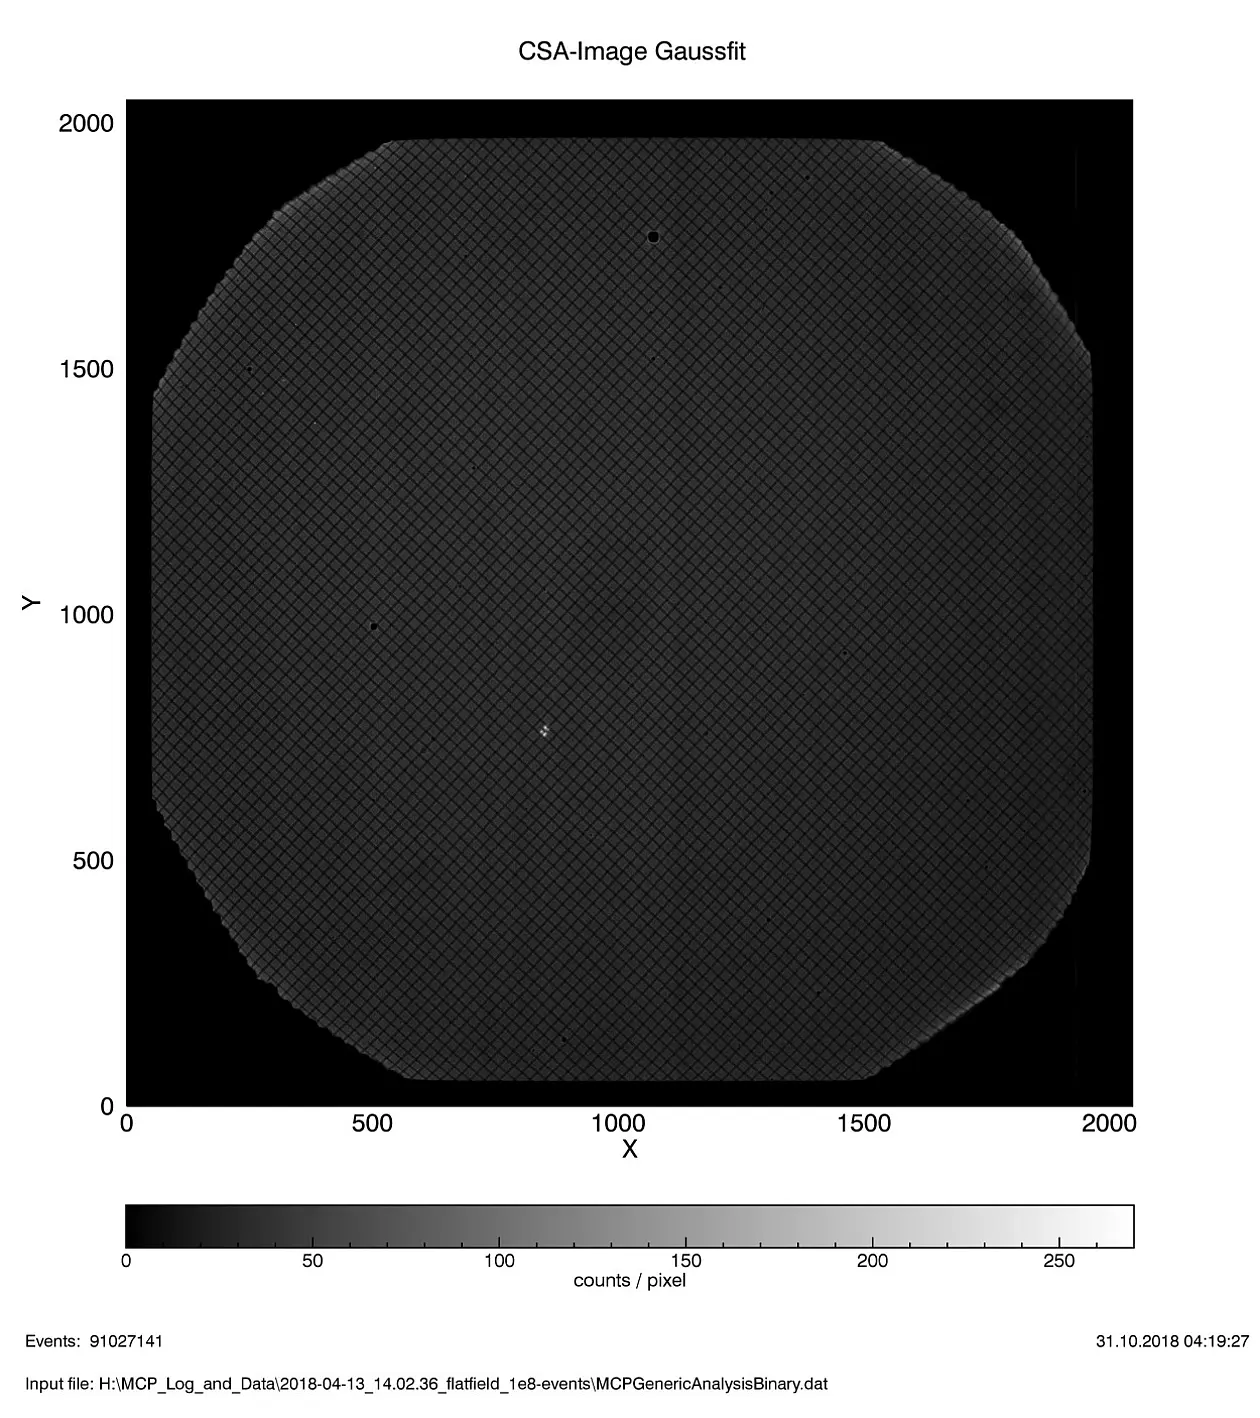
Additionally the homogeneity of the Beetle channels was significantly improved. The second image shows a measurement with a grid in front of the MCPs, illuminated with a parallel beam, such that the shadow of the grid is imaged. The image show a much better homogeneity of the illumination, as well as a very goog imagaging geometry.

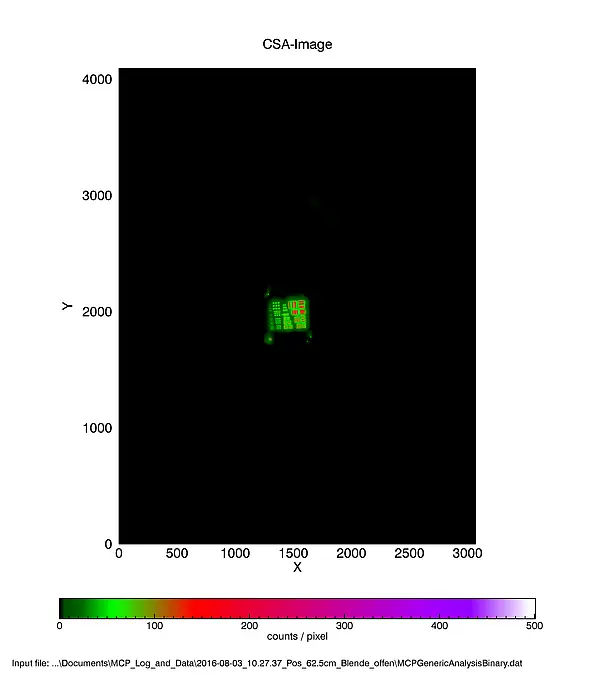
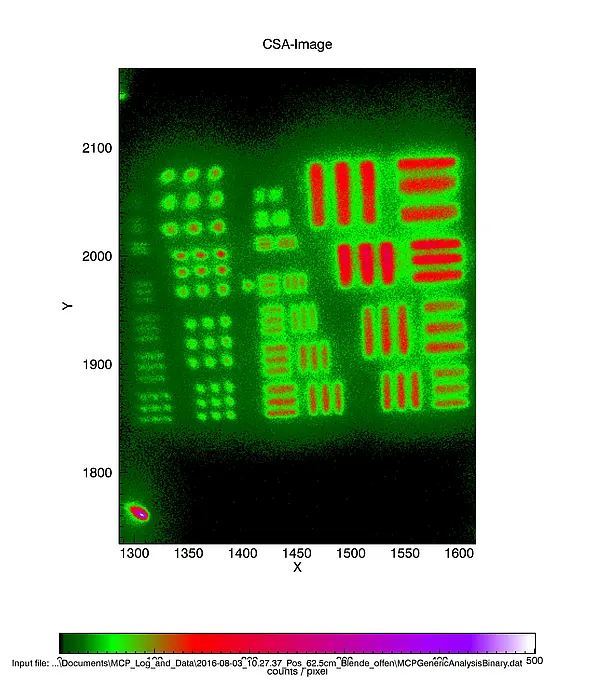
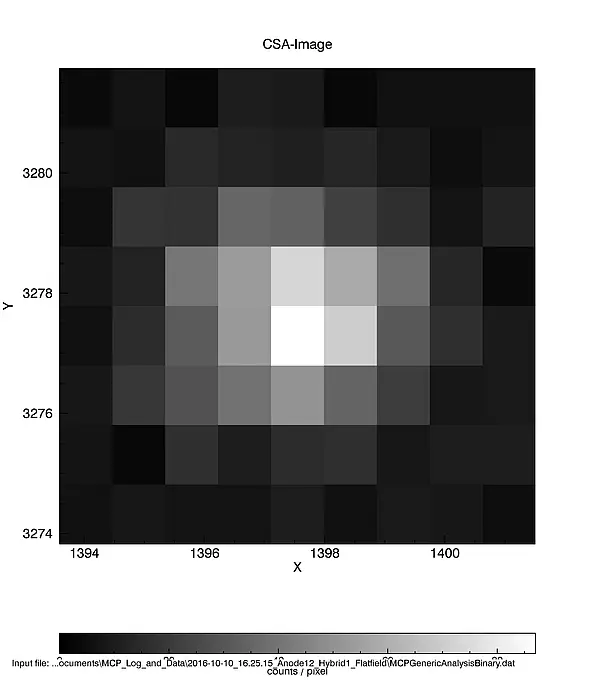
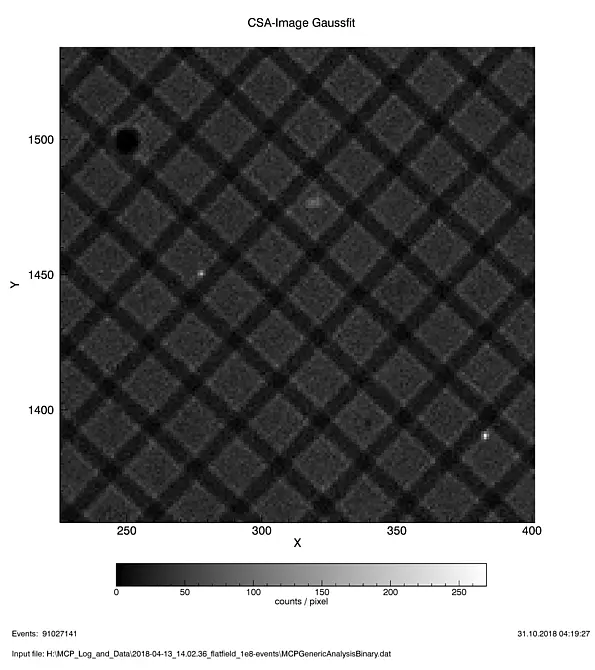
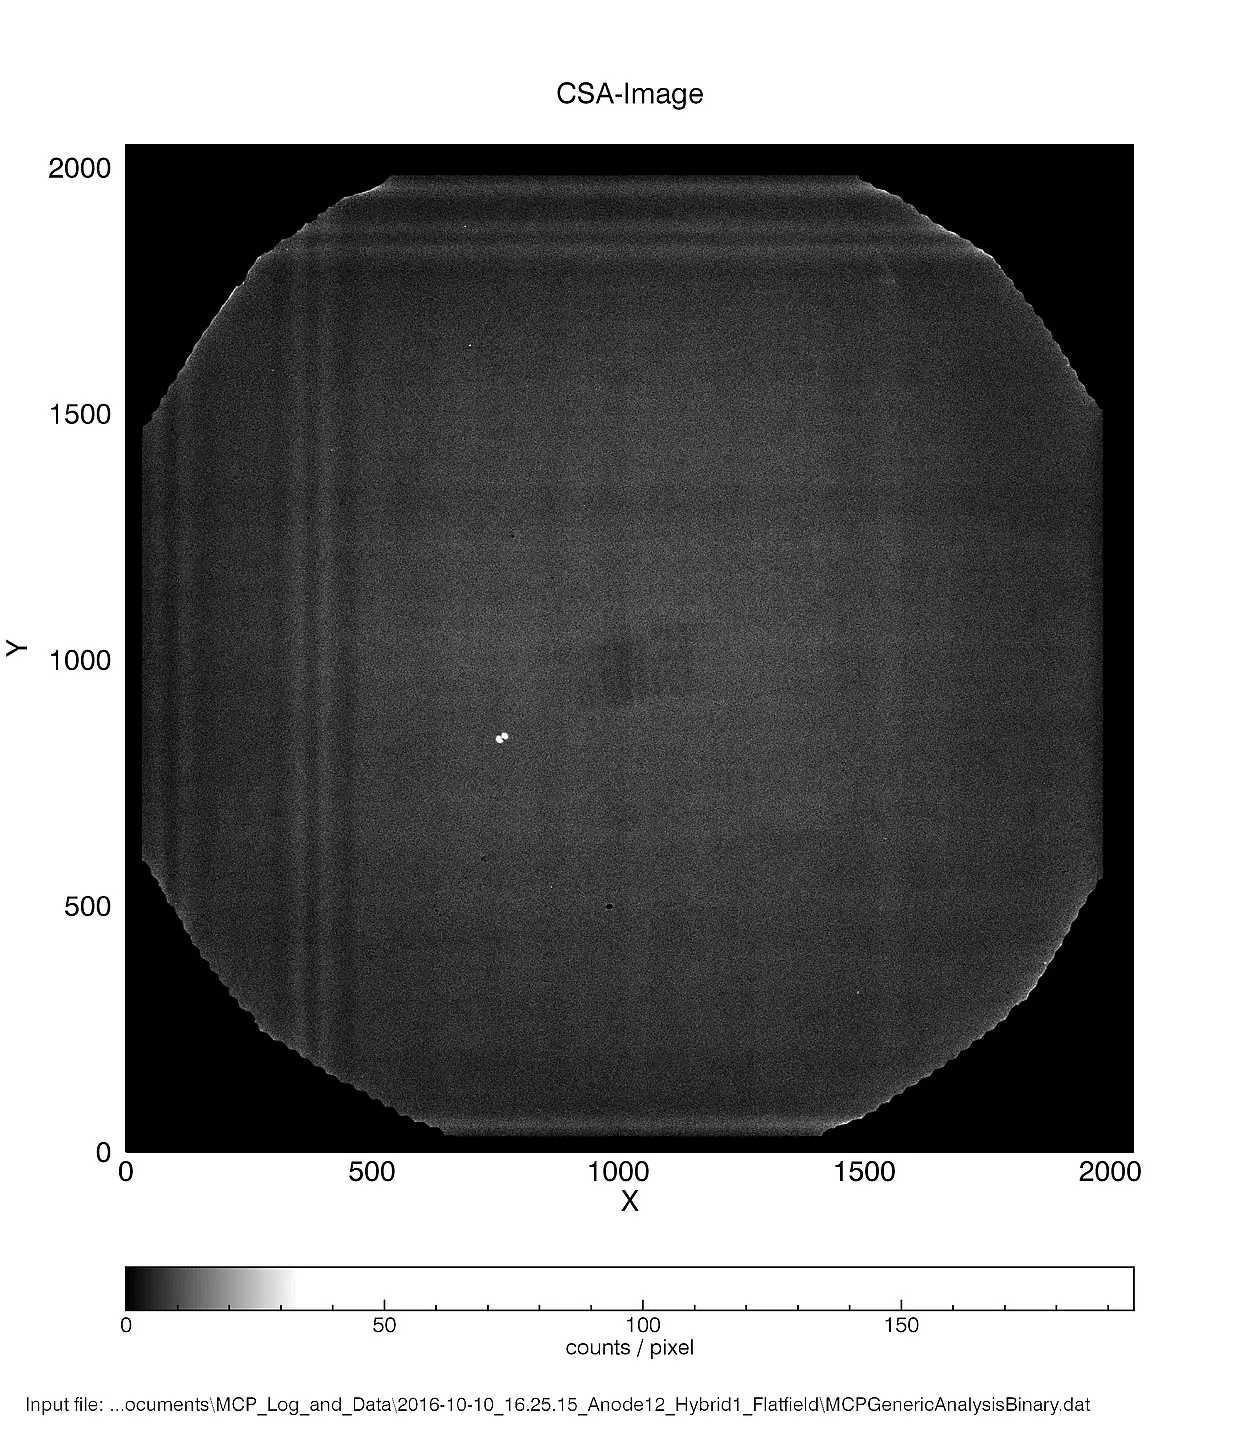
Improving the centroiding algorithm for each event helped to improve the resolution. The third image shows a detail of the second image. The bright points are hot spots (presumably from single MCP channels), which can now resolved within one pixel (20µm). The edges of the grid bars show some brightenings, which are due to the diffraction pattern at the grid bars.

Further Developments