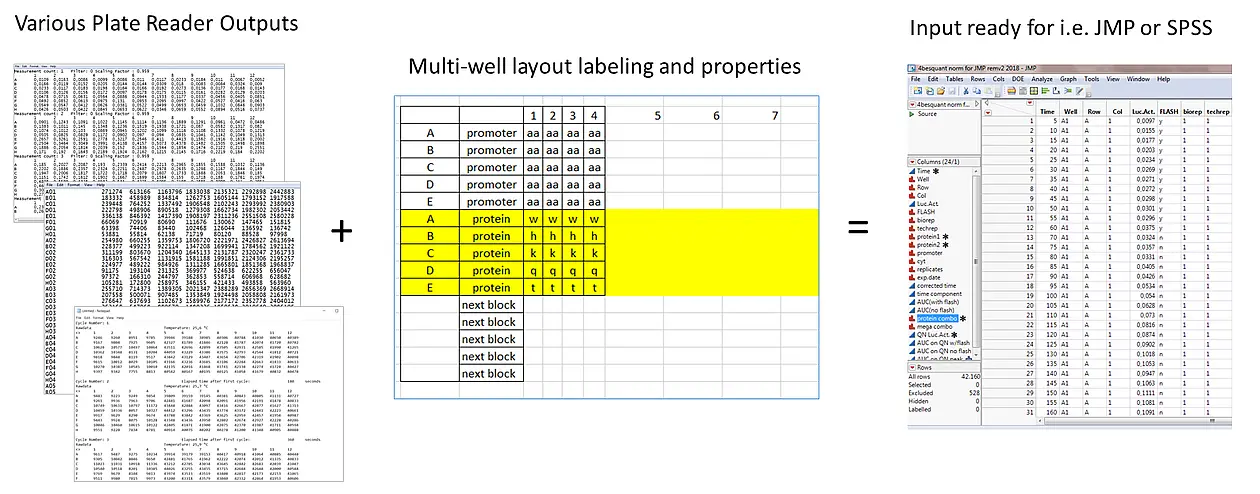
Figure 1. The Basic Idea
Your plate reader output needs to be graphed and analyzed. After drafting and the final output is a tab-delimited table that can be directly imported into JMP® or SPSS for analysis.
The idea is that graphing and primary statistical analysis in JMP® or SPSS is a much more intuitive and effective means of fondling your data to discover relationships as well as presenting it. But, input is made of columns of a specific datatype, followed by rows with the properties of individual items. When working with plate readers we can easily generate a lot of information, especially if one performs kinetic measurements, and this data is not usually in the format needed for JMP® or SPSS. One could move all the data by hand or use other programs/scripts to move the data around or even use the native analysis programs that many plate readers already come with, but the former is too time consuming and the latter usually means that someone is blocking the machine. The Luc Measurement Kinetic Organizer solves this problem.
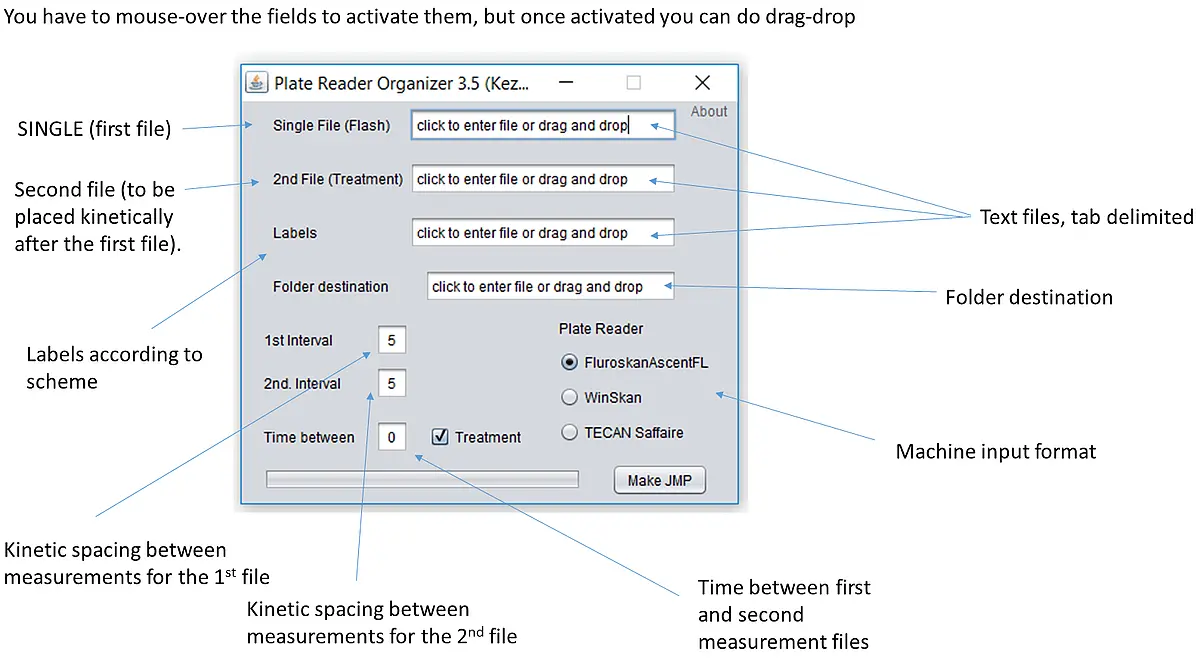
So, the data input and labels need to be in text files. A text file is a file that encodes only text, no colors, highlights, etc. This means that the basic idea is to open the output using a spreadsheet program of your choice and copy the data in the correct format into a text file using a simple text editor e.g. Notepad(Editor) or Notepad++. I recommend using UTF-8 format, but ASCII is also find in most cases. In addition, we need to have a way to label all of the wells in a multi-well plate. This is also done in a spread sheet program first, as it is much easier to label and mark things in color if it helps you keep track of what is what, and then copy the table into a text file as well. The text file will ignore all the color or lines of course. Once you have your data text file and your labels text file you are ready to use the program.
